Candlesticks
I think everyone that trades in markets such Forex, Cryptocurrencies, Exchanges and so on is familiar with candlestick charts to view and analyze prices. Experts could look into these charts and find repetitive signs and patterns to forecast the market trends and so will be able to sell or buy just to the point. The better the predict the more profits or less losses.
I would like to share with you the top 5 powerful patterns to help you better view and analyze the market.
History, where does it come from?
According to Steve Nison, candlestick first appeared sometime after 1850 by a Japanese trader named Homma from the town of Sakata.
Formation
Every candle is built by four parts: Body, Shadow, High/Low and Open/Close
The relationship between the open and close is considered by means of the price movement of that candlestick. Hollow candlesticks, where the close price is greater than the open price, indicate buying pressure. Filled candlesticks, where the close price is less than the open price, indicate selling pressure. You may see some charts that Hollow candles are in green and Filled candles are in red colors, they have the same meaning no differences.

Candle names:
Long / Short bodies
The long bodies shows the pressure, long Black or Red shows selling pressure and long White or Green shows buying pressure and vice versa for short bodies.
Long / Short shadows
Spinning Tops
Doji
Shows Buyers (Bulls) and Sellers (Bears) are balanced.
It's time to dive into 5 most powerful patterns.
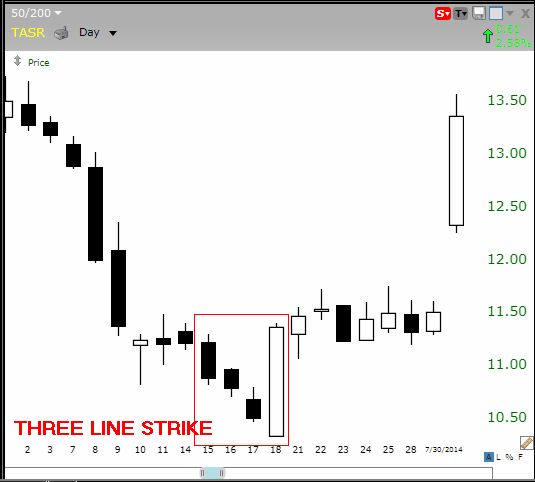
Three Line Strike
The bullish three line strike reversal pattern carves out three black candles within a downtrend. Each bar posts a lower low and closes near the intrabar low. The fourth bar opens even lower but reverses in a wide-range outside bar that closes above the high of the first candle in the series. The opening print also marks the low of the fourth bar. According to Bulkowski, this reversal predicts higher prices with an 84% accuracy rate.
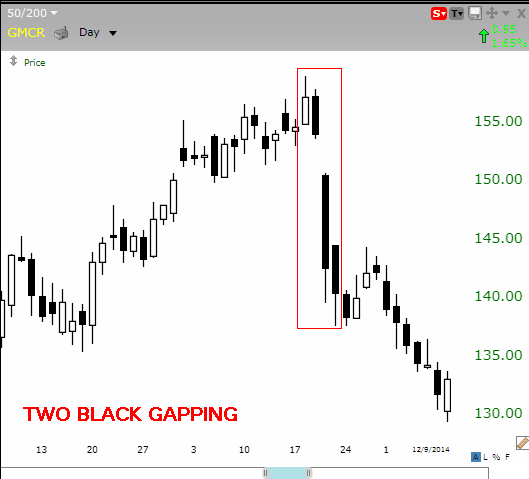
Two Black Gapping
The bearish two black gapping continuation pattern appears after a notable top in an uptrend, with a gap down that yields two black bars posting lower lows. 68% accuracy.
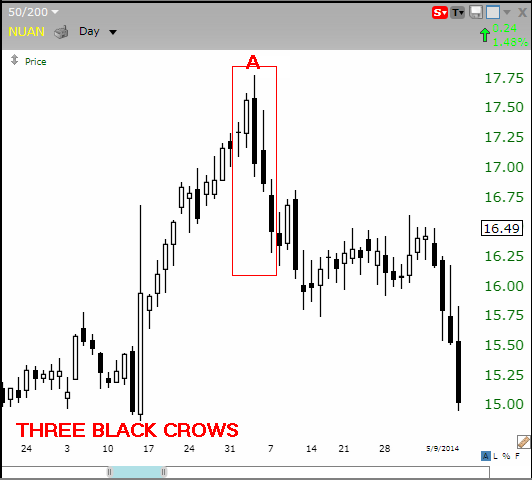
Three Black Crows
The bearish three black crows reversal pattern starts at or near the high of an uptrend, with three black bars posting lower lows that close near intrabar lows. This pattern predicts that the decline will continue to even lower lows, perhaps triggering a broader-scale downtrend. 78% accuracy.
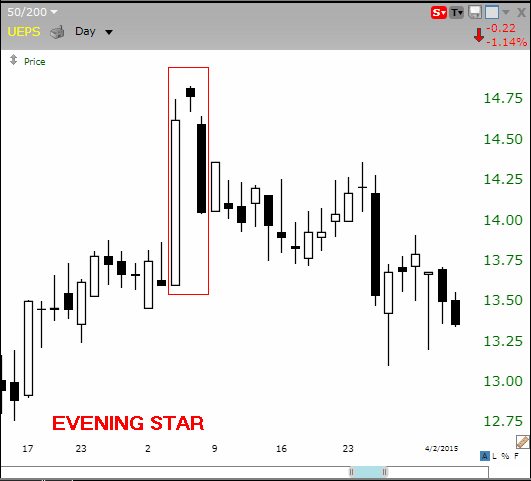
Evening Star
The bearish evening star reversal pattern starts with a tall white bar that carries an uptrend to a new high. The market gaps higher on the next bar, but fresh buyers fail to appear, yielding a narrow range candlestick. A gap down on the third bar completes the pattern, which predicts that the decline will continue to even lower lows, perhaps triggering a broader-scale downtrend. 72% accuracy.
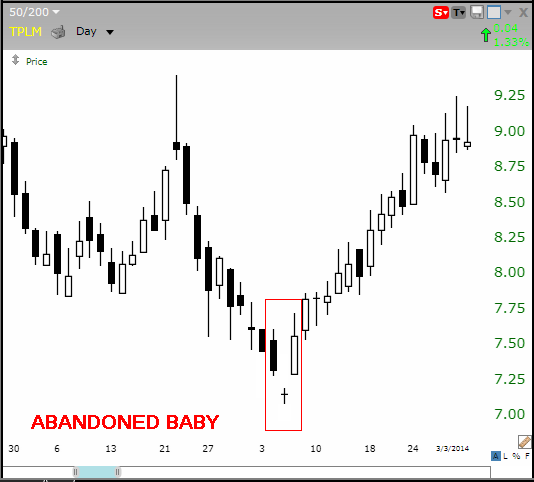
Abandoned Baby
The bullish abandoned baby reversal pattern appears at the low of a downtrend, after a series of black candles print lower lows. The market gaps lower on the next bar, but fresh sellers fail to appear, yielding a narrow range doji candlestick with opening and closing prints at the same price. A bullish gap on the third bar completes the pattern, which predicts that the recovery will continue to even higher highs, perhaps triggering a broader-scale uptrend. 70% accuracy rate
Hamidreza Asgari
June 11, 2017