Hello Steemers!

Decided to do a chart on ETH today, 2nd crypto on the coinmarketcap ranking and consistent volume.
Charts will be from Poloniex as it has the most volume.
The charts will start up messy as usually but did my best to work out and leave as few lines as possible :)
Will show mostly weekly charts.
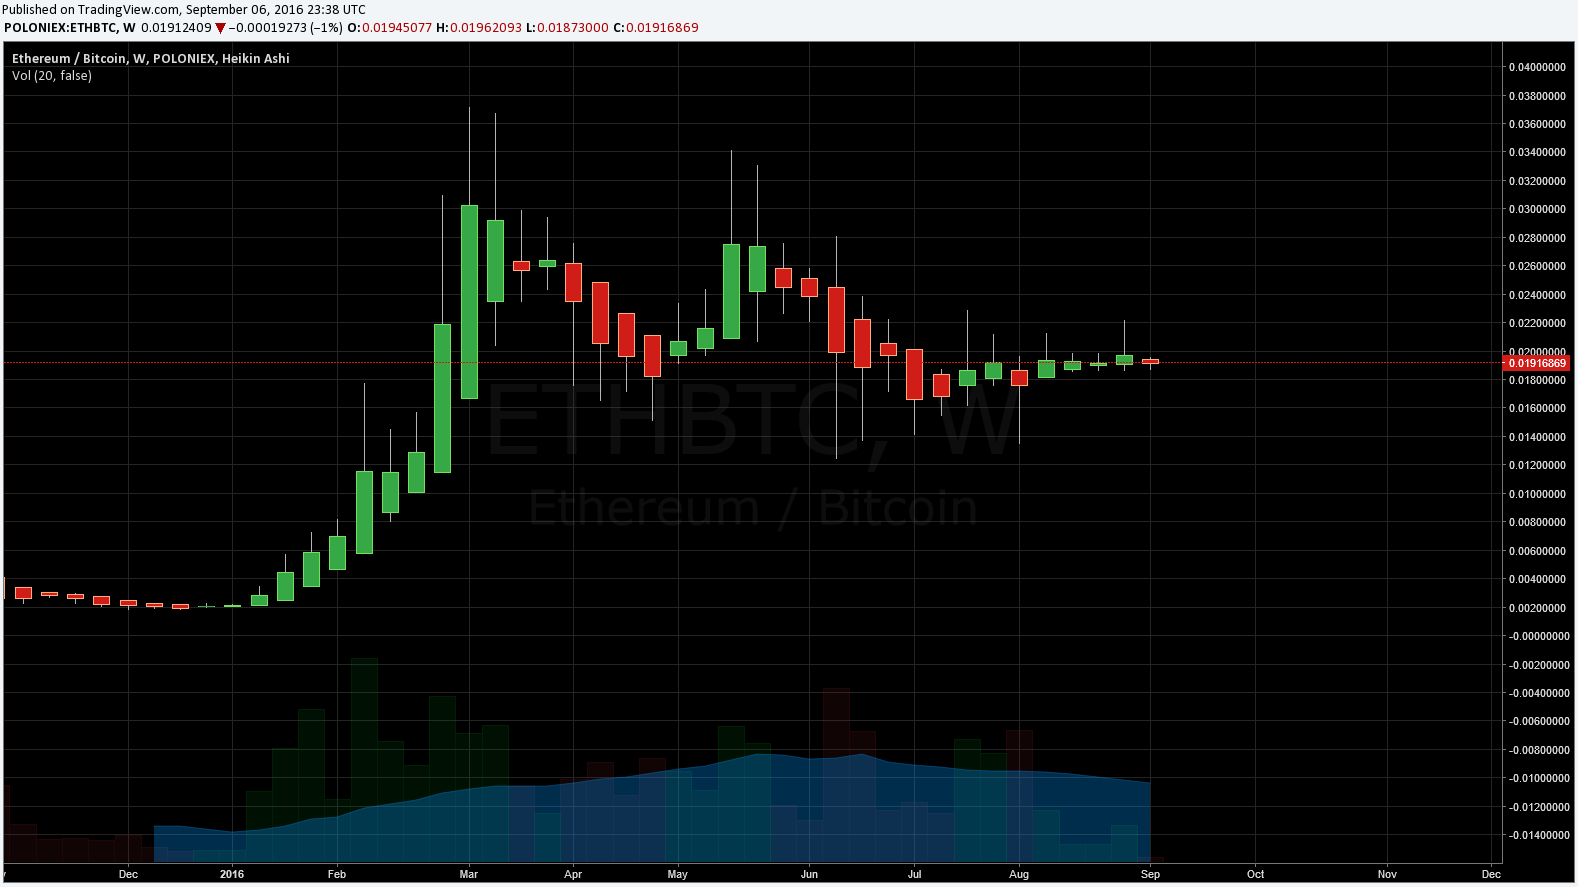
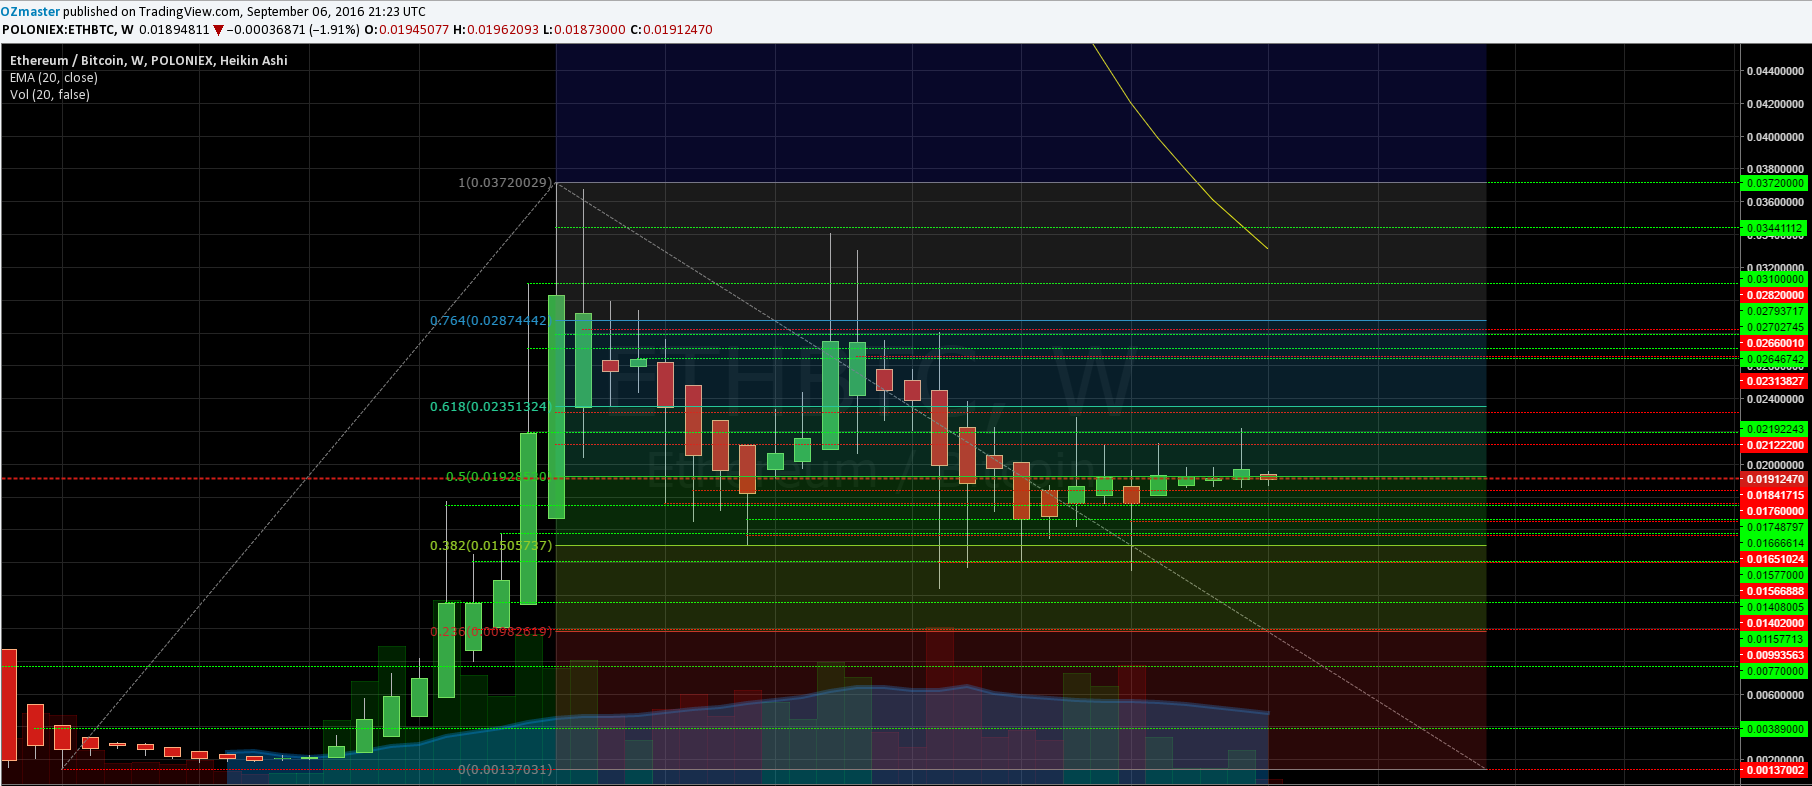
ETH/BTC Poloniex - 1 week chart clean
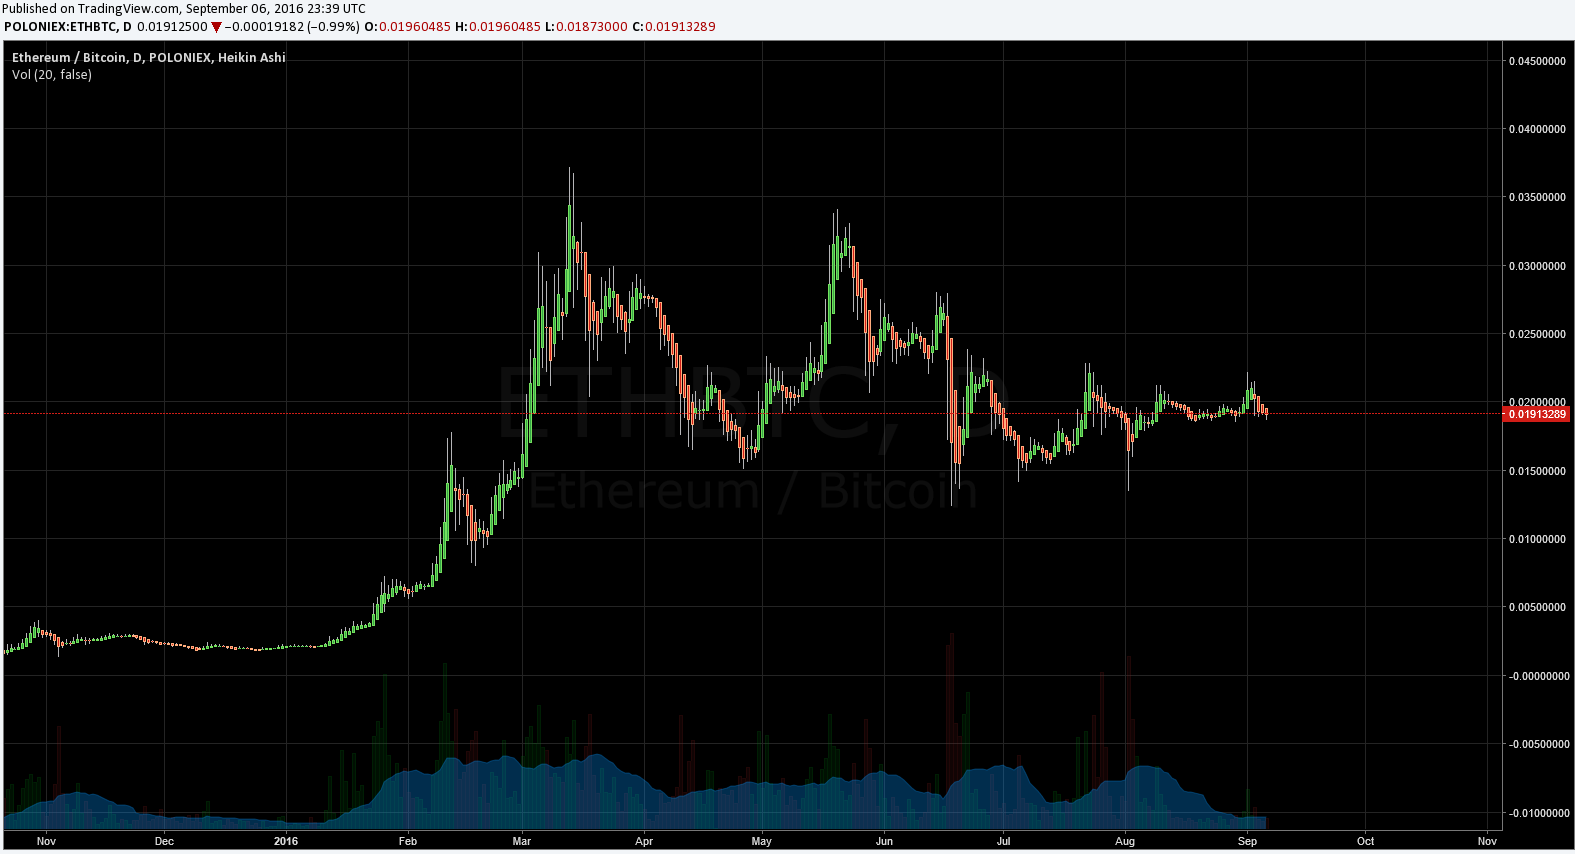
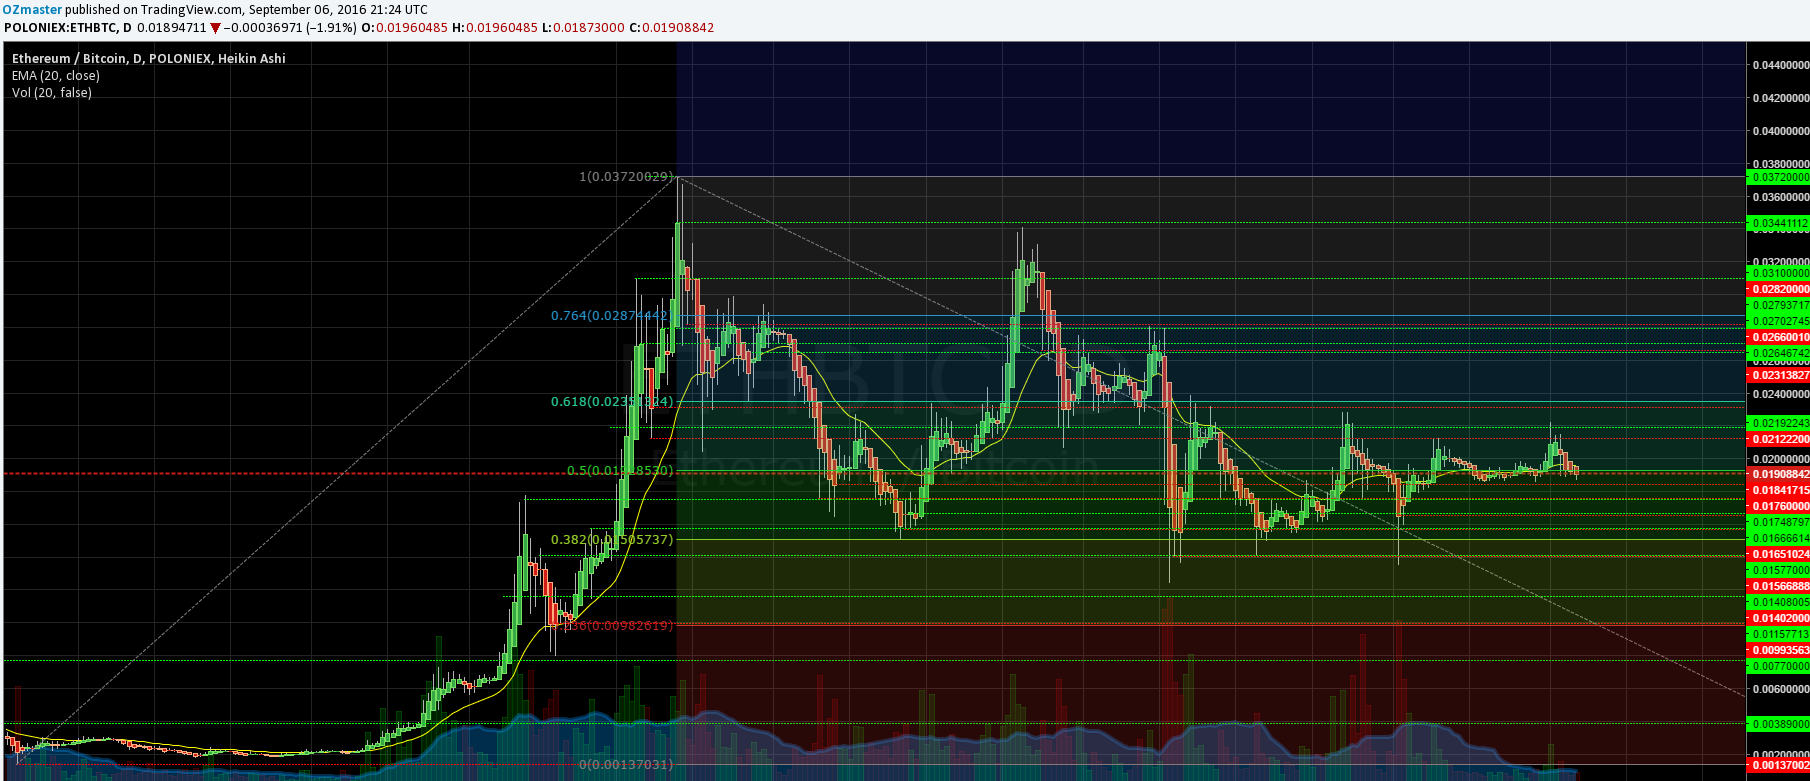
ETH/BTC Poloniex - 1 day chart clean
For start the clean charts, we can see that the weekly volume is slowly getting lower, but on the daily we can see that the sells dominate the volume bars.
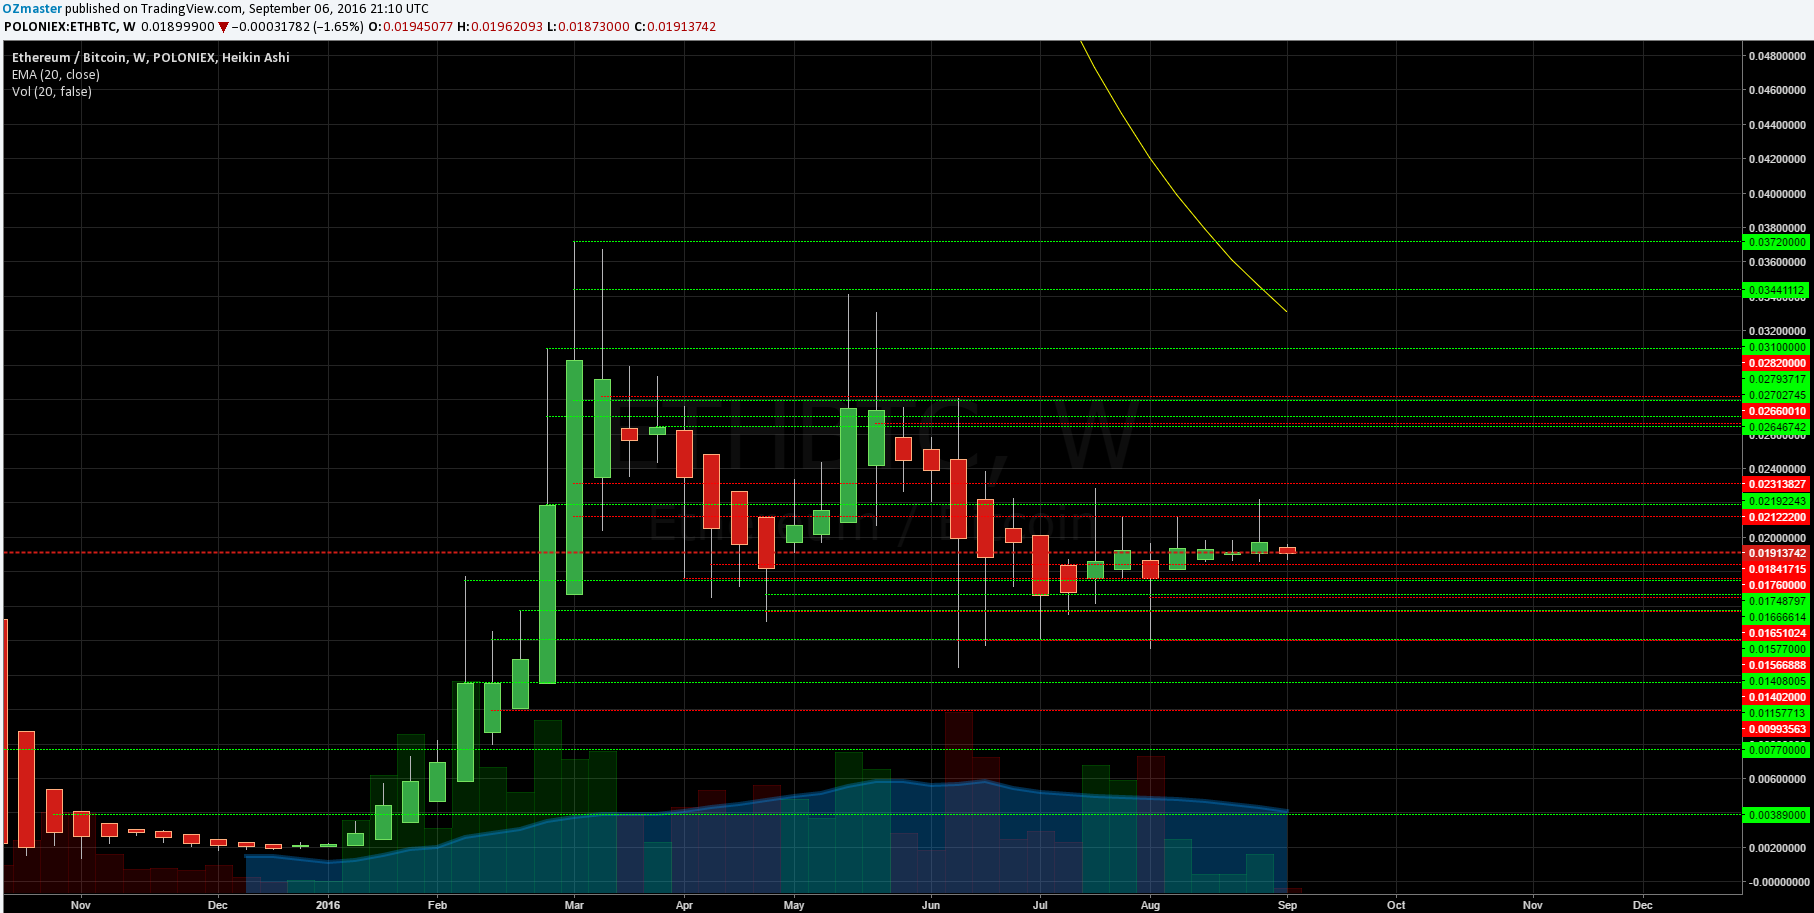
ETH/BTC Poloniex - 1 week chart highs and lows marked
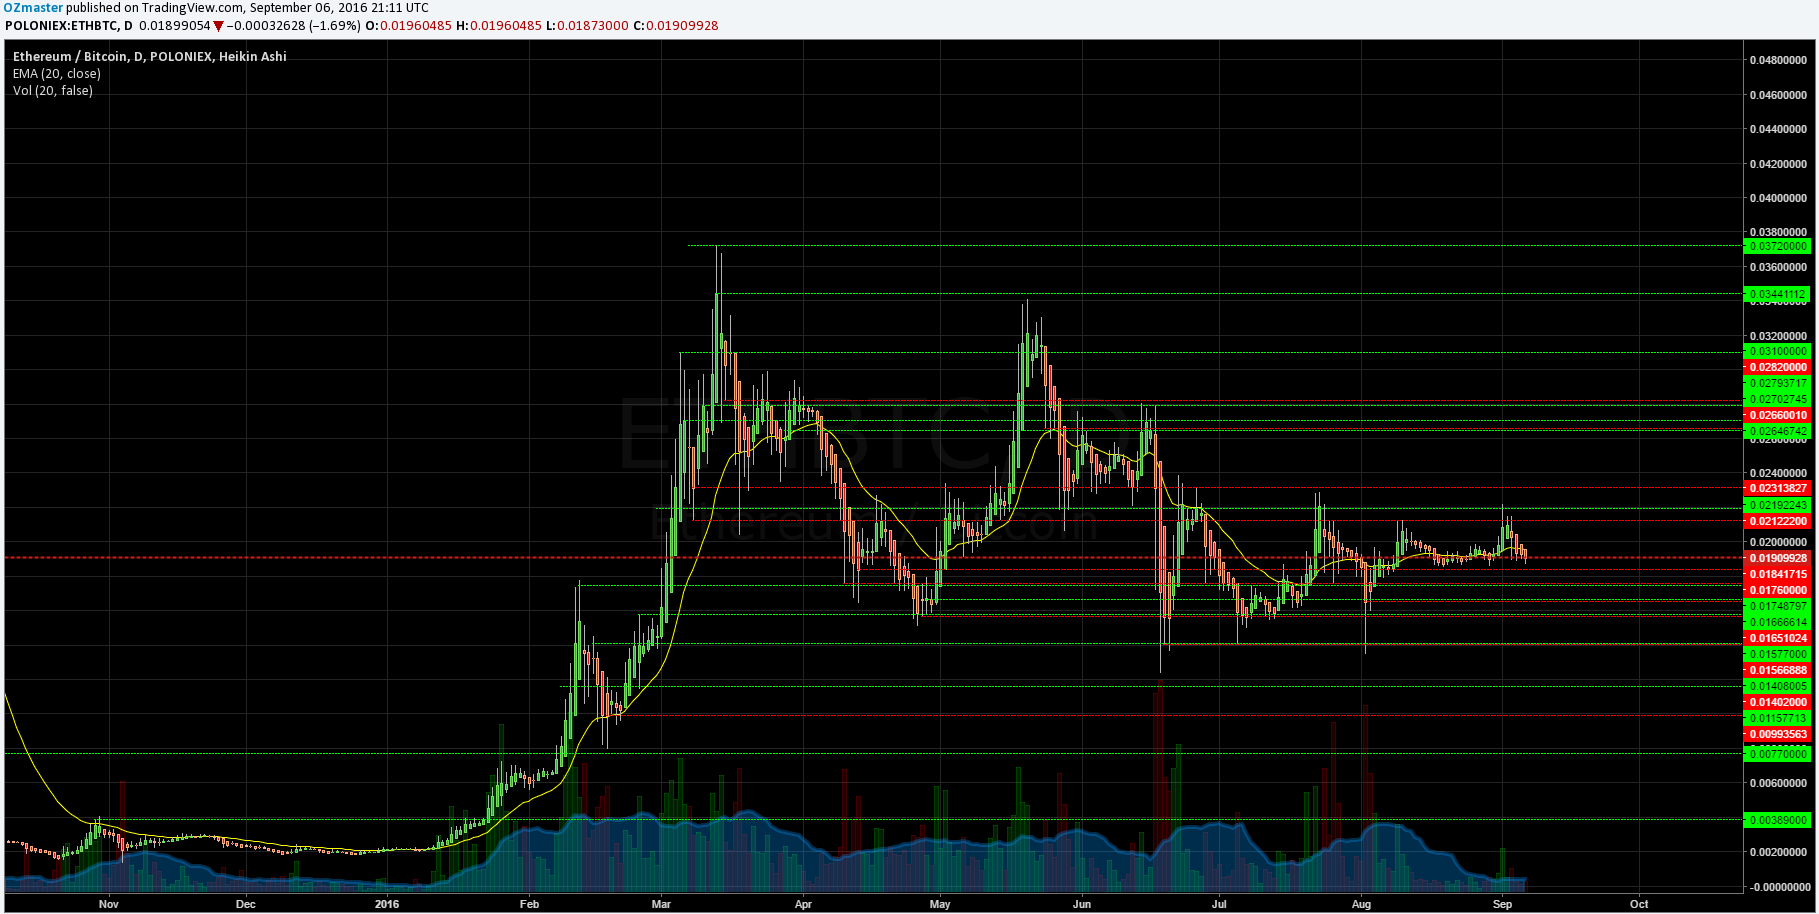
ETH/BTC Poloniex - 1 day chart highs and lows marked
I started off by marking the previous highs and lows, ending up with a huge mess (which i usually keep on the chart, dunno why, i like the mess),
ETH/BTC Poloniex - 1 week chart highs and lows marked + fib
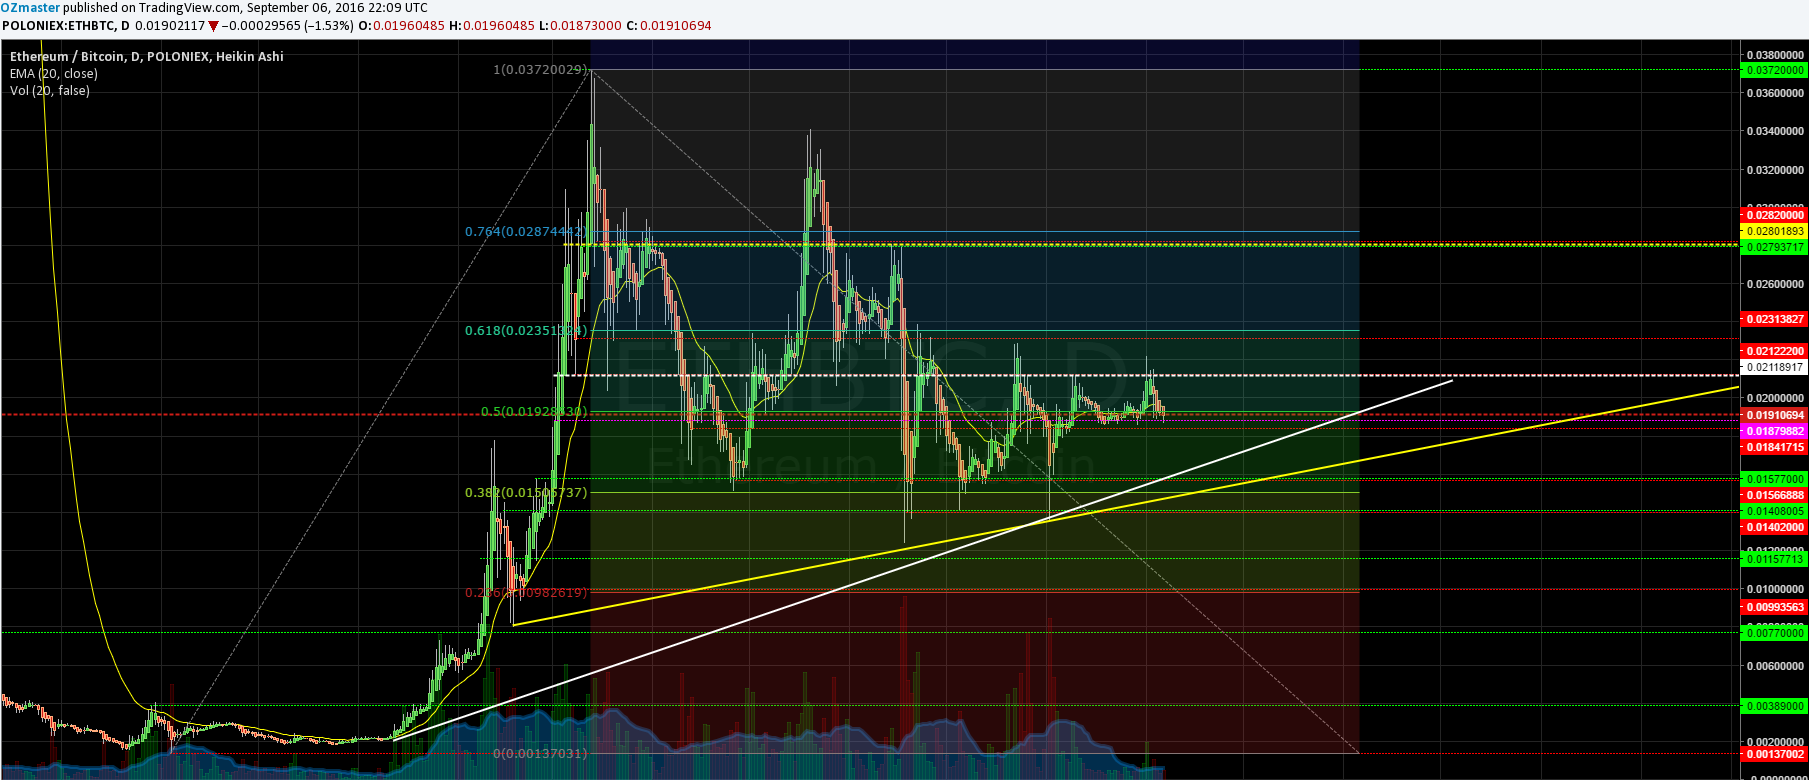
ETH/BTC Poloniex - 1 day chart highs and lows marked + fib
Added the Fib, all the way from the lowest to the highest point. Thanks to the fibs i can see a bit clearer which highs and lows could play a more important role.
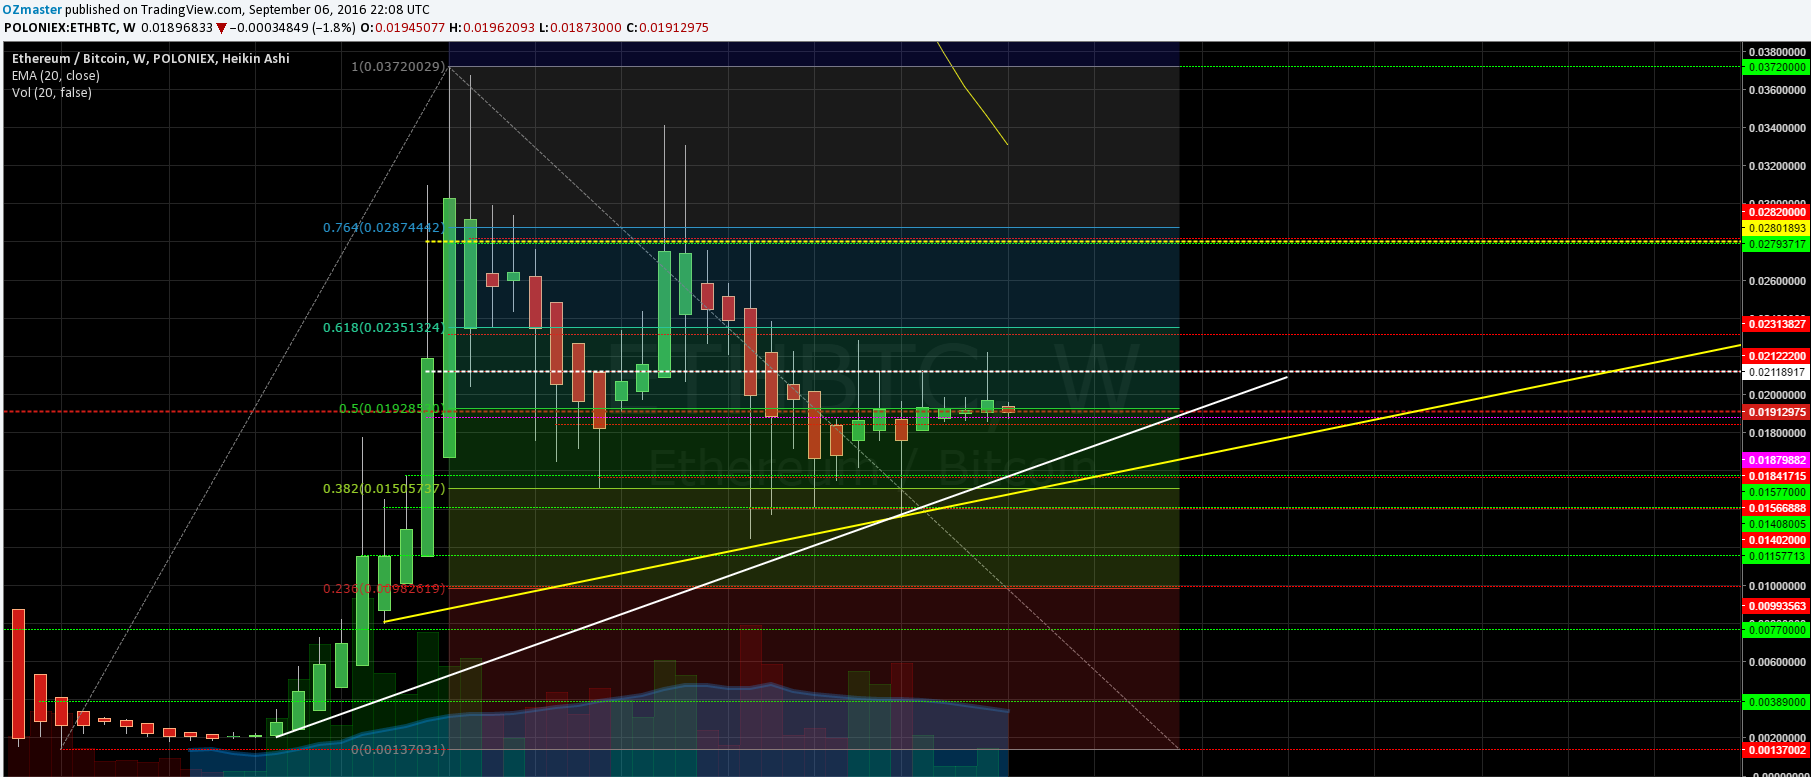
ETH/BTC Poloniex - 1 week chart highs and lows marked + fib+triangle
ETH/BTC Poloniex - 1 week chart highs and lows marked + fib+triangle
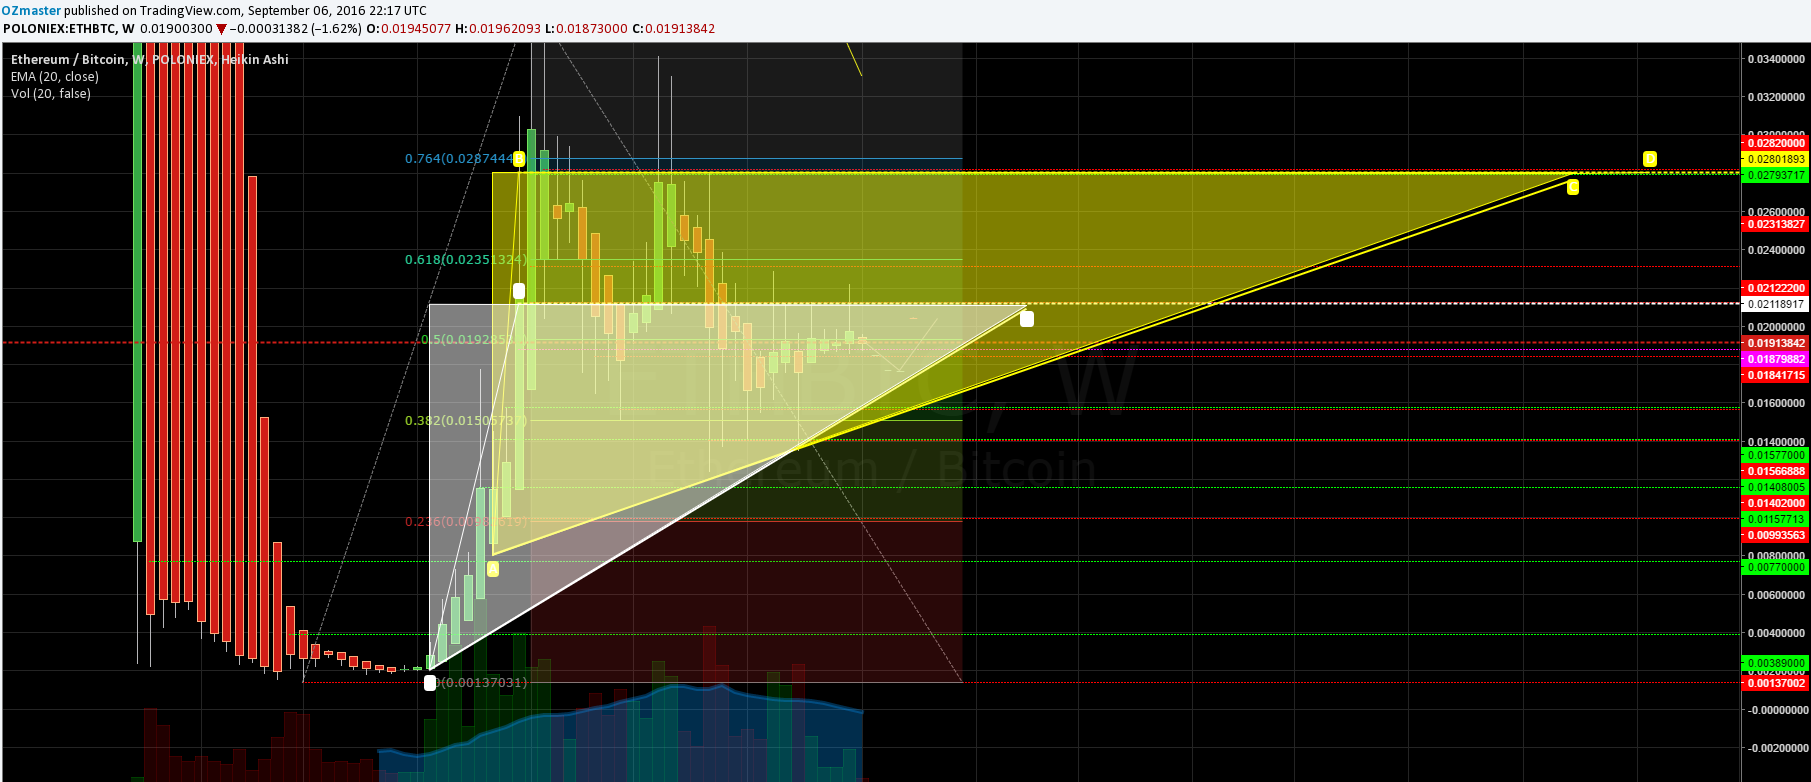
ETH/BTC Poloniex - 1 day chart highs and lows marked + fib+triangle
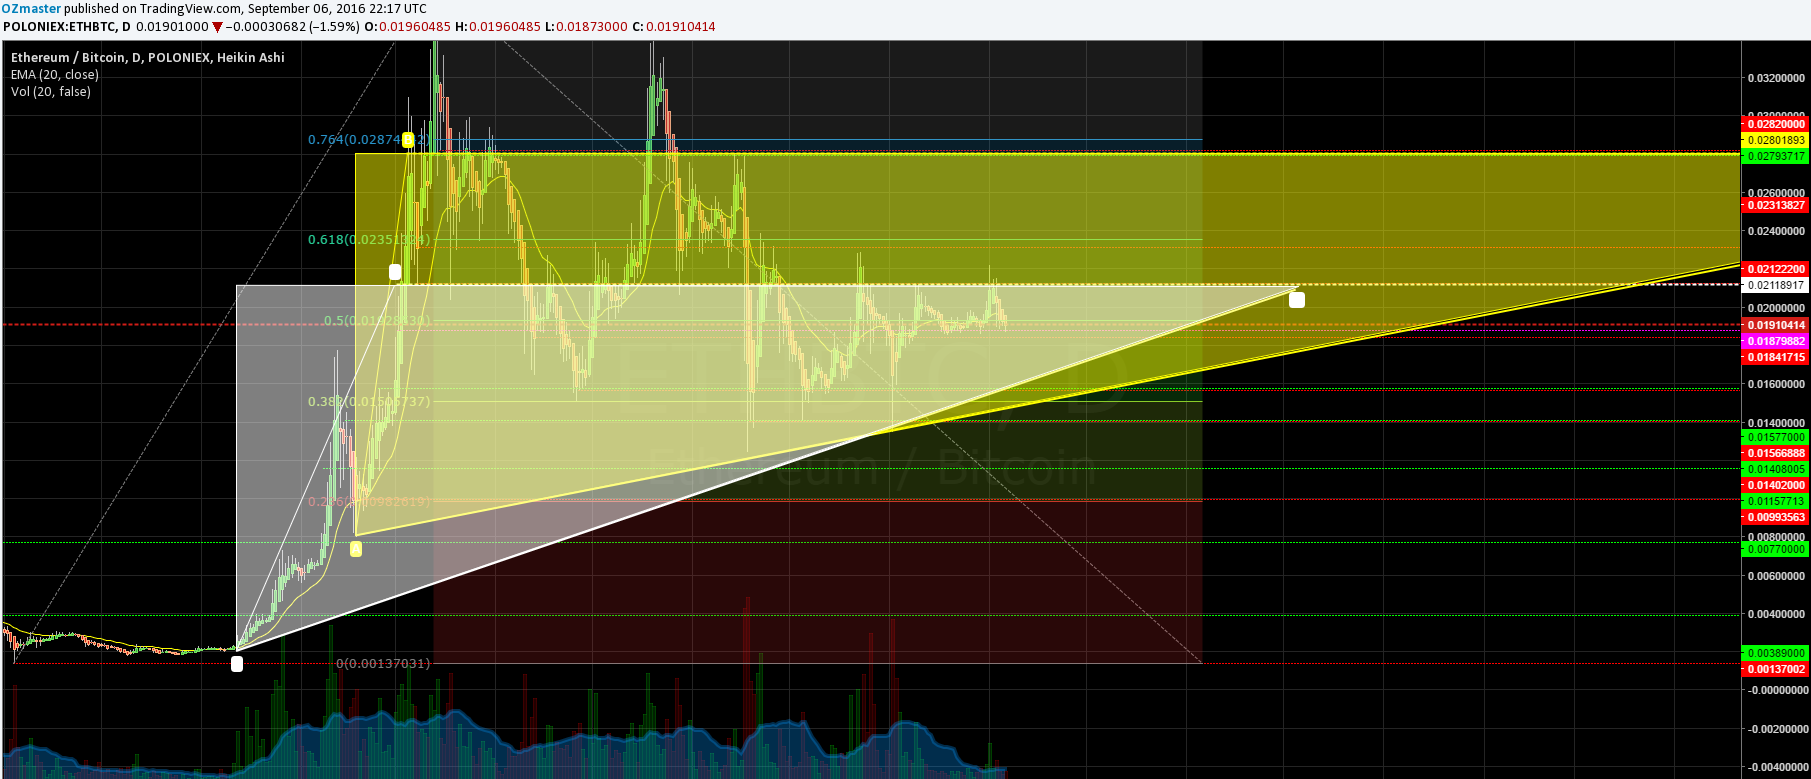
ETH/BTC Poloniex - 1 day chart highs and lows marked + fib+triangle
Removed allot of lines thanks to the fib and noticed some triangle patterns, also painted the full color so everyone can see what my eyes are looking at.
With everything I like in place, time for some scenarios of how the price could possibly move (according to my imagination...).
Uptrend scenarios
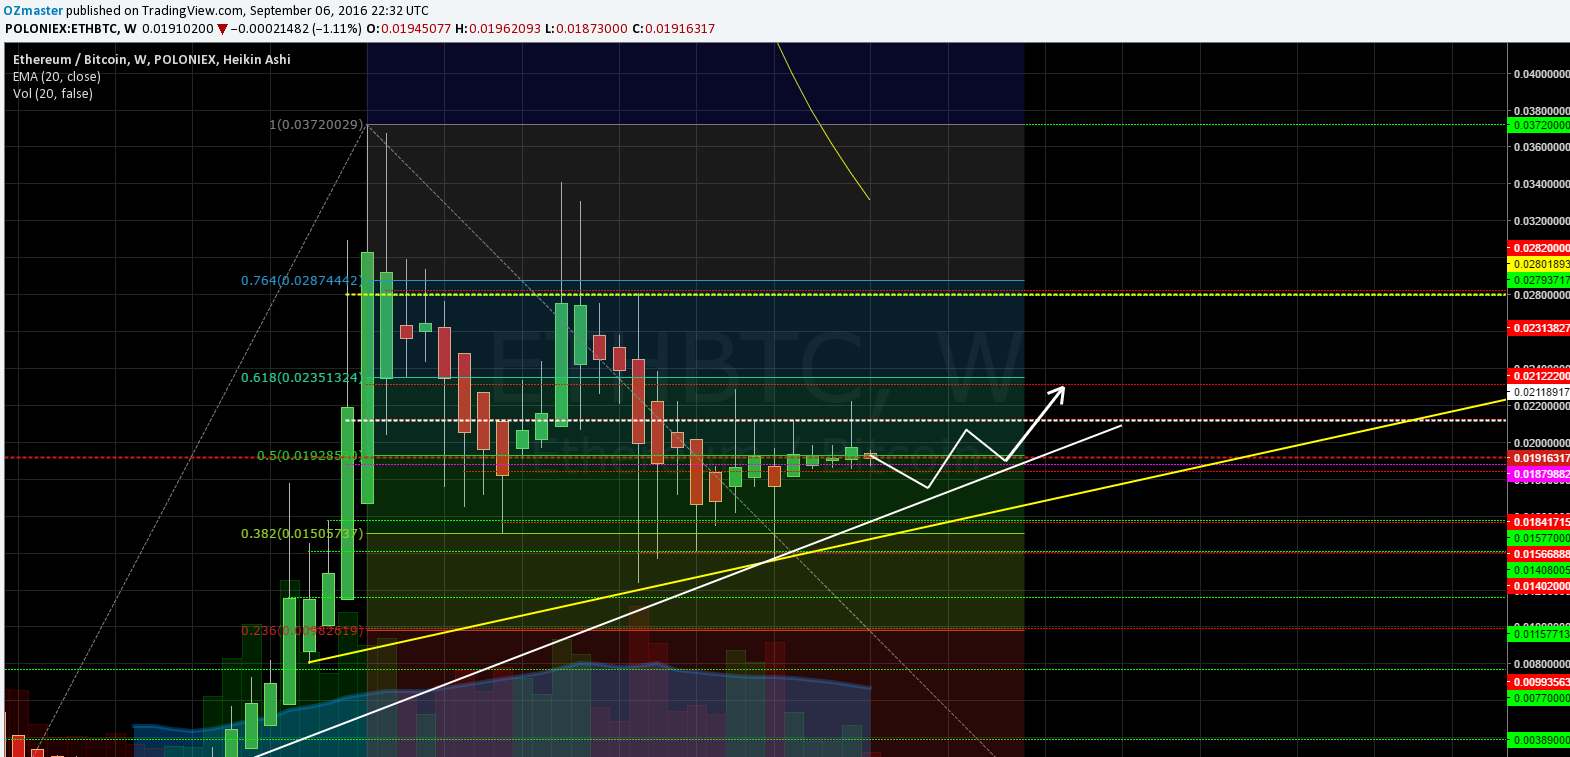
ETH/BTC Poloniex - 1 week chart uptrend scenario 1
A harder uptrend scenario which could possibly happen. The price breaking out of the white triangle making it's top line a support level.
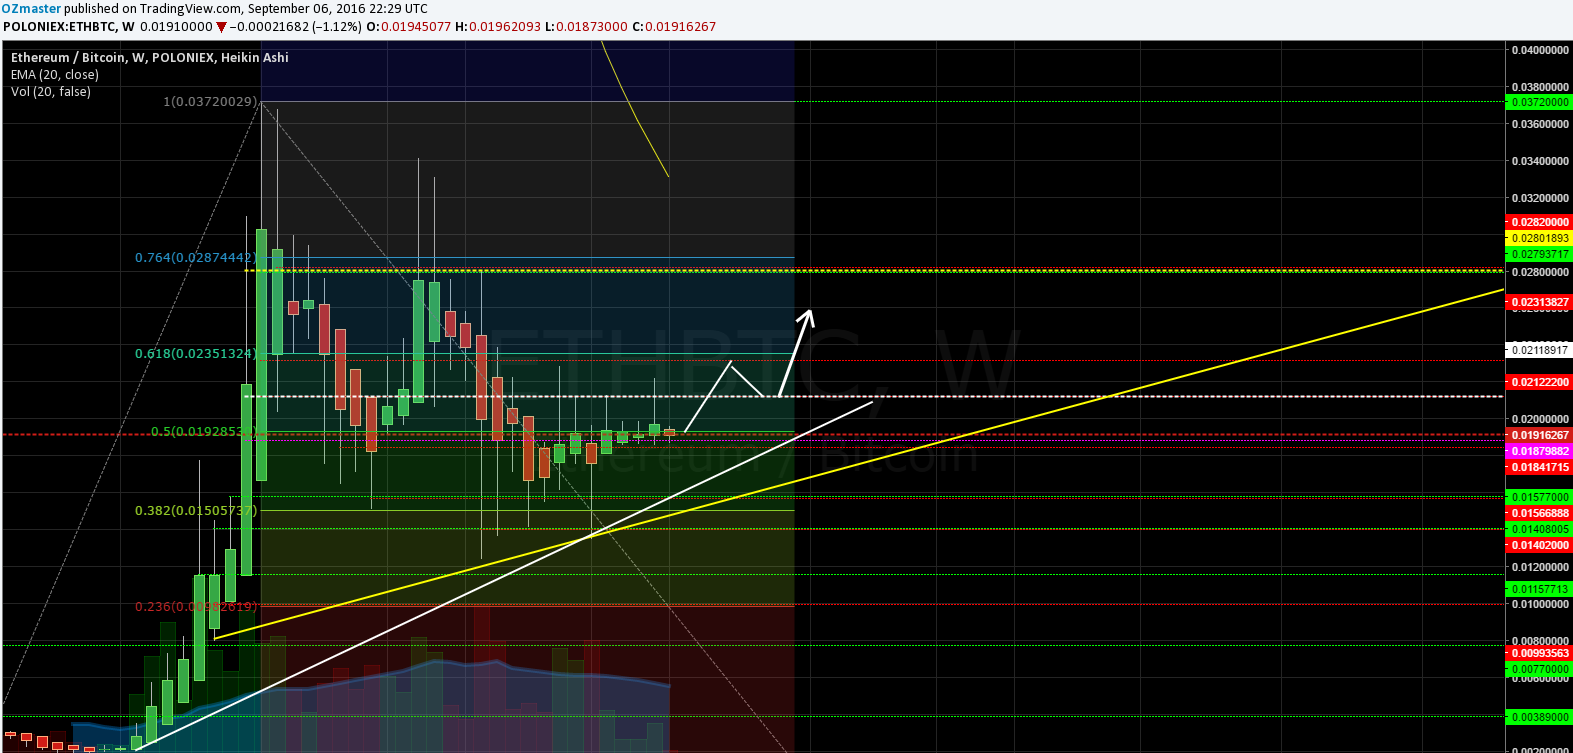
ETH/BTC Poloniex - 1 week chart uptrend scenario 2
A milder uptrend scenario which could possibly happen. A bit more accumulation before the price breaks the white triangle in and makes it top line new support level and going into further accumulation with mild uptrend.
Downtrend scenarios
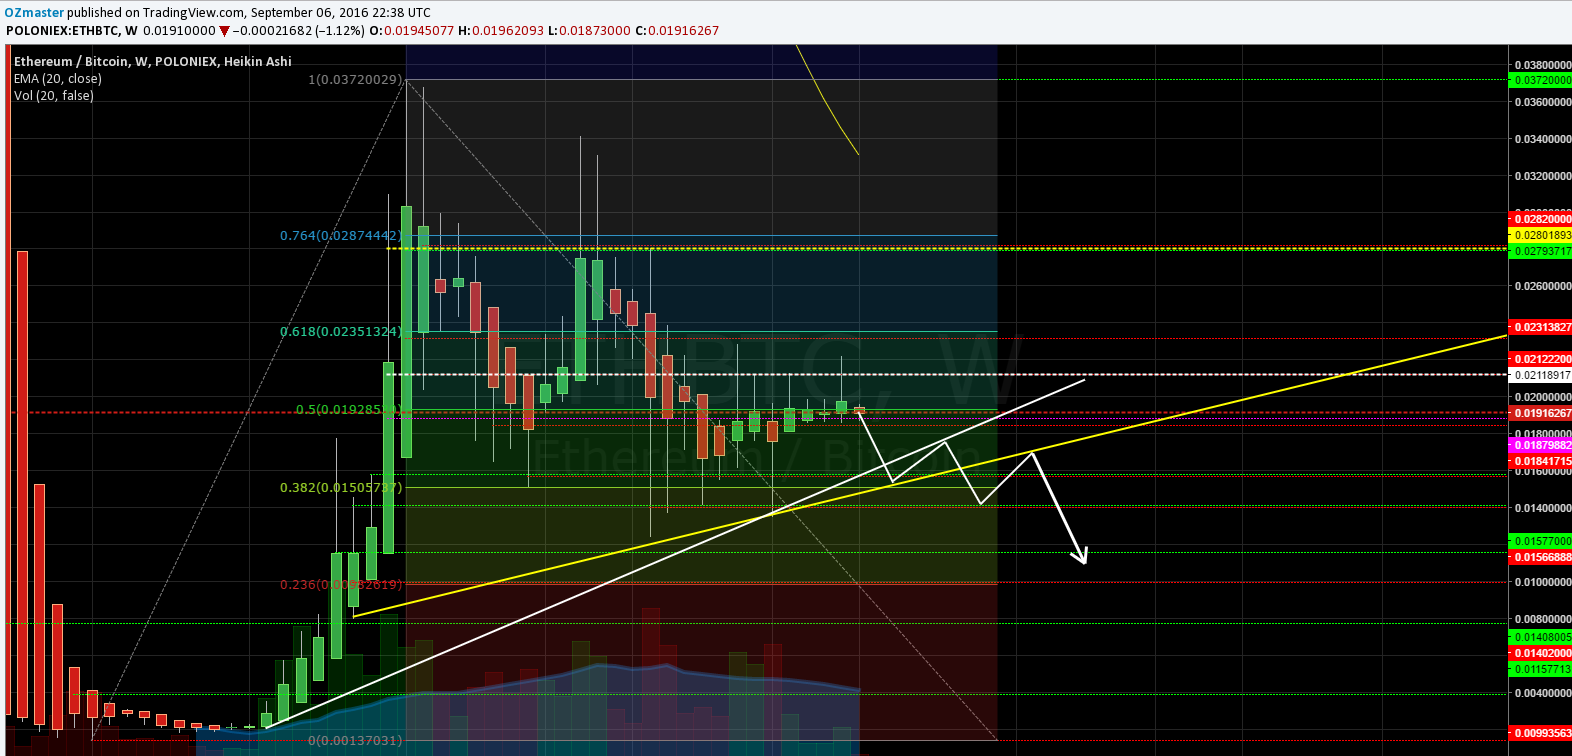
ETH/BTC Poloniex - 1 week chart downtrend scenario 1
A harder downtrend scenario which could possibly happen. The price breaks both the white and the yellow triangles toward the bottom without any problem aiming for new local lows.
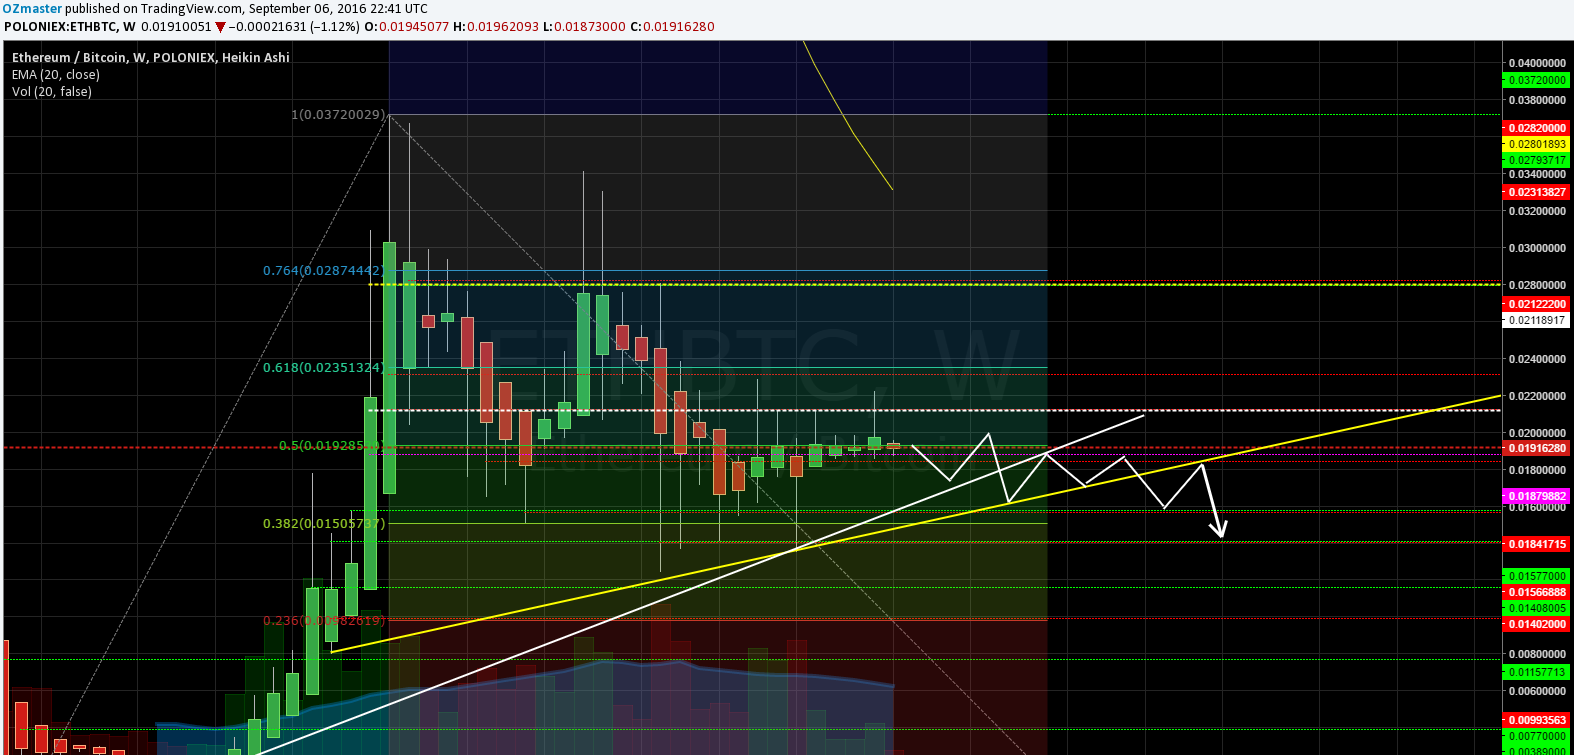
ETH/BTC Poloniex - 1 week chart downtrend scenario 2
A milder downtrend scenario which could possibly happen.
The price breaks through both the white and the yellow triangle downwards, but had more problems, thus keeping in the range of the previously made local low.
COMMENT
Once again, I will post the comment by commenting as it involves my personal opinion!
Thank you for understanding!
If anyone has any questions or need's help fell free to ask, I will try to explain as fast and as best as I can.
Critics, comments, reply's, counters, advice's, etc. are always welcome!
Have my charts helped you in any way?Let me know with a comment below :)
Are there more people who are doing TA?
Please post the links to your TA's posts into the comments as well!
DISCLAIMER
I am showing multiple scenarios on the price movement, in the post itself I do not take any stance, either bullish or bearish. I am not responsible for neither you’re winning nor you're losses upon trading! the "comment" section is my personal opinion and does not mean I have to or do hold any positions in the given market.
Everyone who uses TA develops his own unique charting style, please keep that in mind.
Kind regards, OZ :)