
**Let's see the daily chart for WTC / BTC.
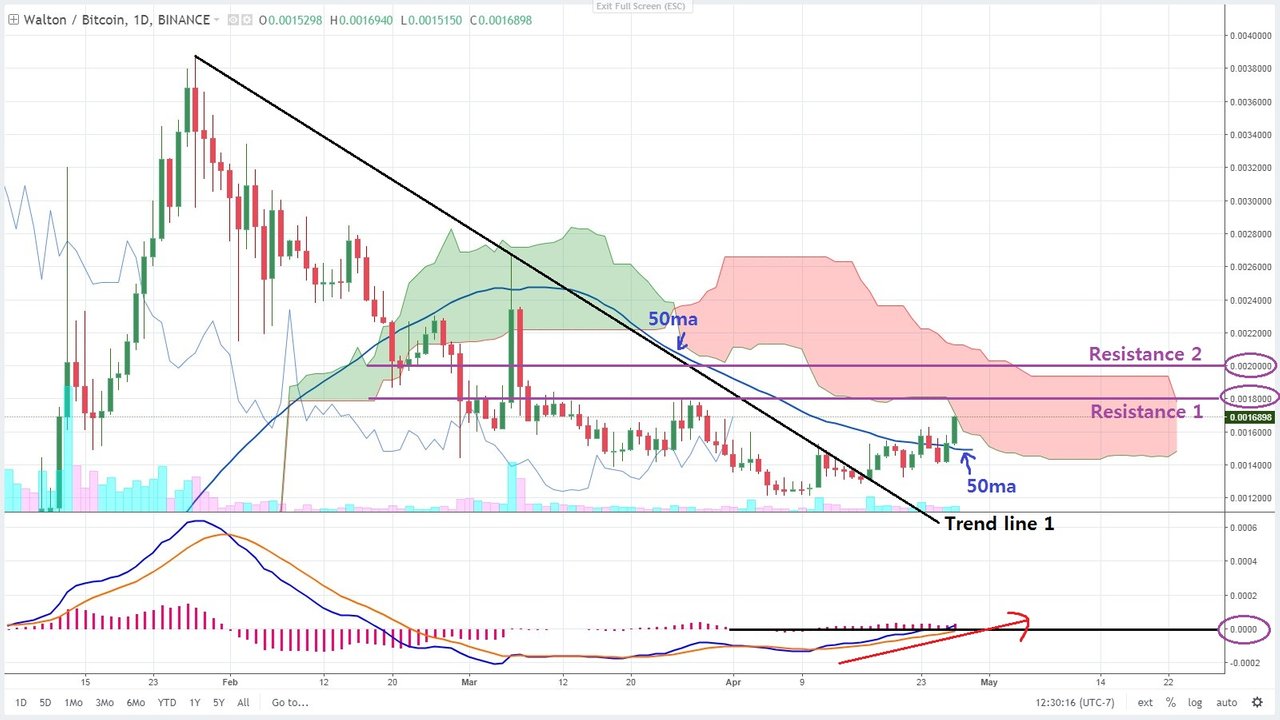
- 50MA retest has been done.
- MACD is rising and it is above 0 but barely.
- It is still under ichimoku cloud.
- There is a resistance @ 0.0018000
and another one @ 0.0020000
**Let's look @ another chart for WTC / BTC.
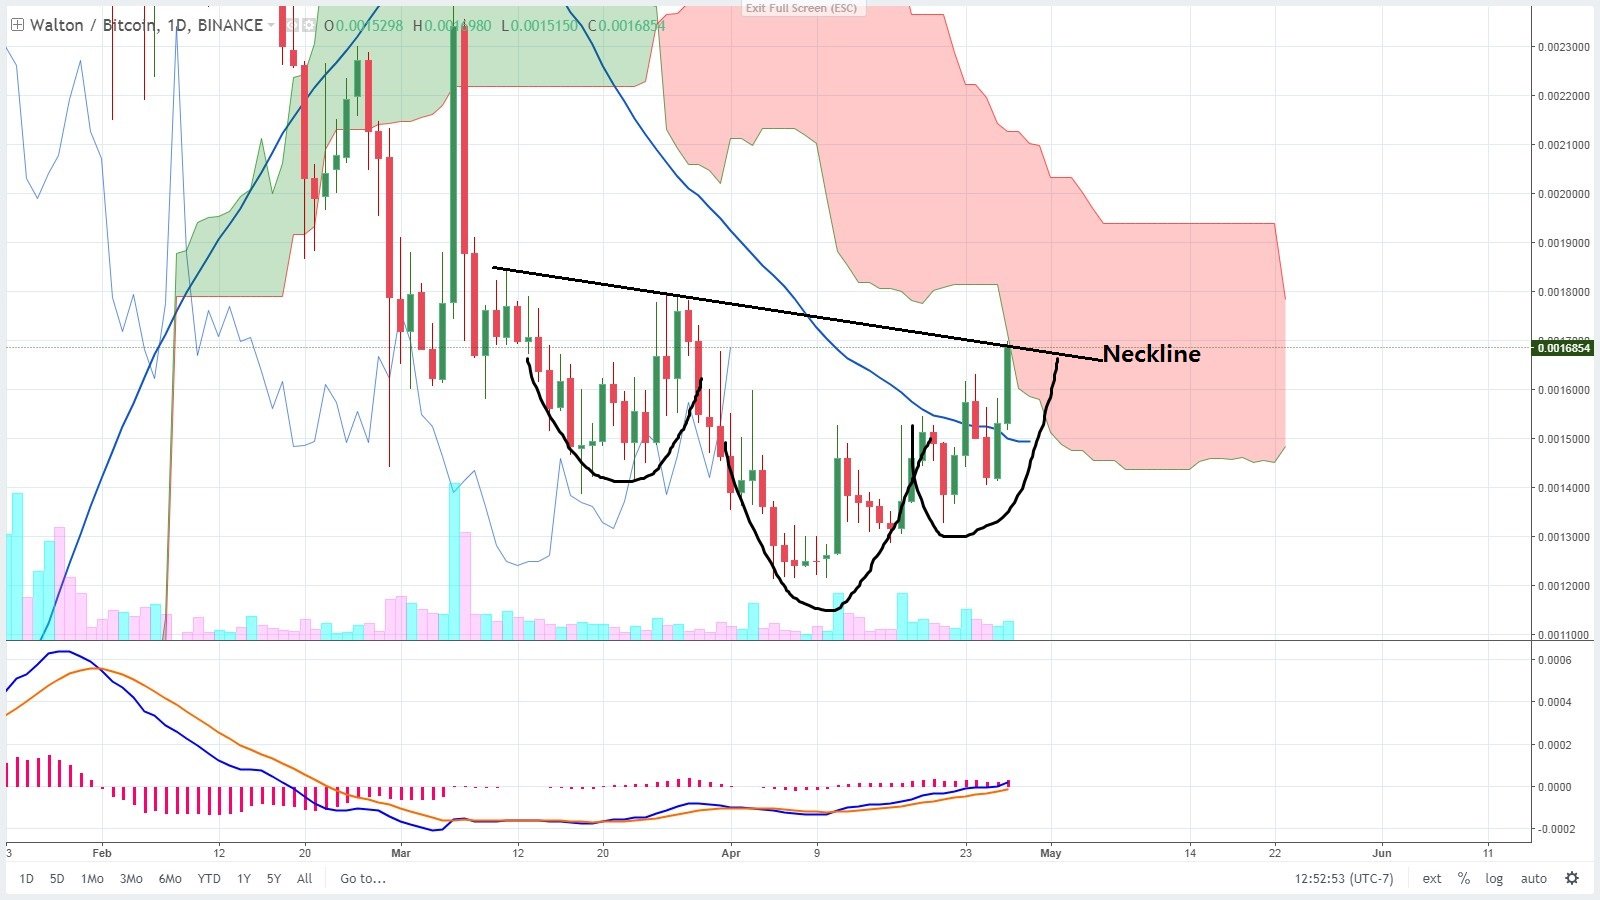
- It looks like reverse head & shoulder...
- Hopely volume increases...
for SWING trade. 0.0015000 is the 50MA area
and it might retest 50MA again...
Therefore I am putting in the limit orders from 0.0015000 to 0.0016850 (current price) with every 0.0000050 increment.
Hoply it works for me!