Hey Steeminas, dear BEER lovers
today I got the fun to play with some cool steem functions.
The wonderful @bluerobo explained in his post @bluerobo/se-charts-beer ho to handel the source informations and I did a bit Excel around this.
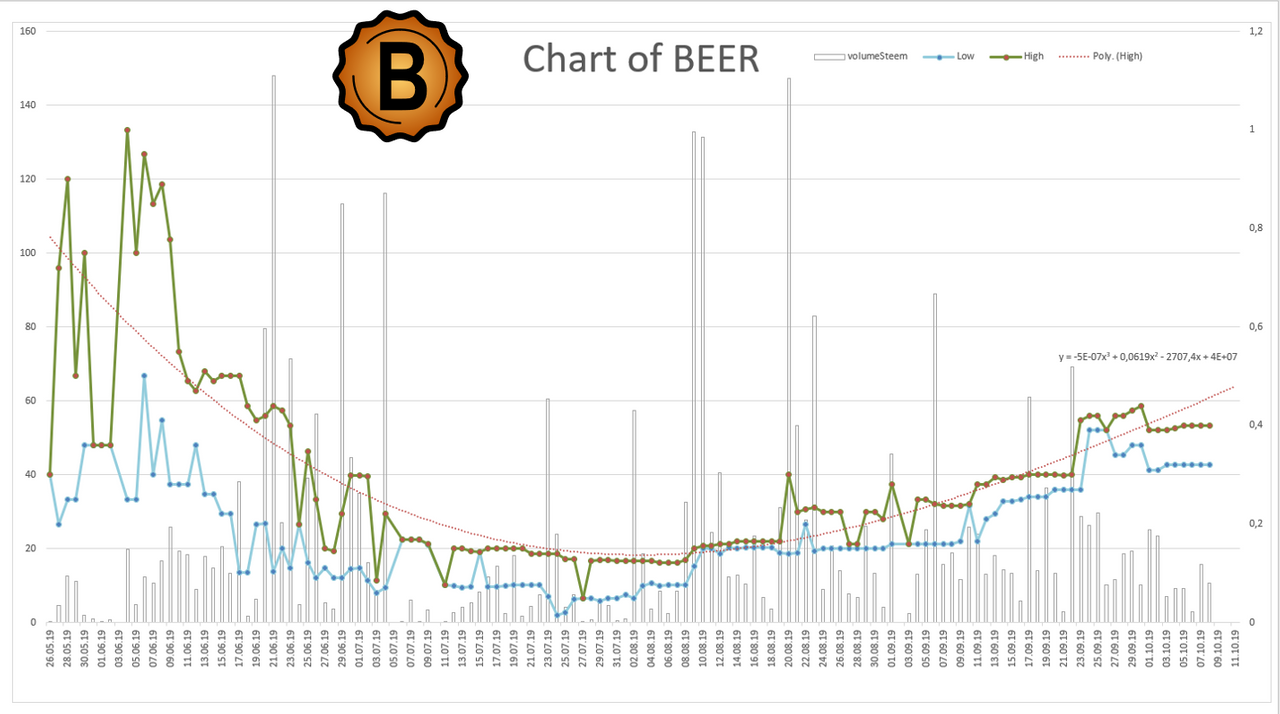
Chart from 26th of Mai to 8th of October

Here you see
Daily High - the green line with red dots
Daily Low - the blue line
Daily Trade Volume of Steem - the grey graph
Trendline of Daily High the red doted line
This is the first version
This is the first try and we will find a way to optimize the graph and all the related information.
If anybody like to have the source of my excel, please contact me

Yes, you might do this with any other token as @bluerobo shows in his blog. Go there and follow him!
How to do this
actually, I feel a bit bad, as I copied all this from @bluerobo, but as I mention him for his great work, he might be not to angry. ;-)
Just 4 steps to get the data
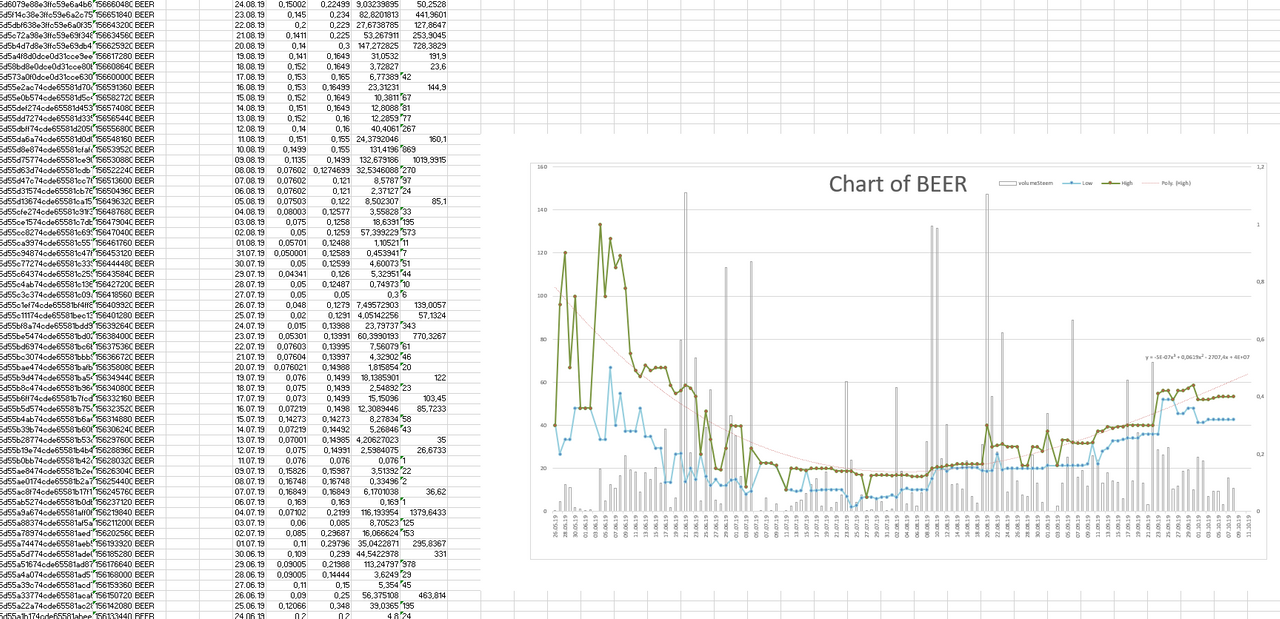
- This is the call I used for the above data: https://api.steem-engine.com/history/marketHistory?symbol=BEER
- Convert the raw .json data into .csv: https://json-csv.com/
Convert the time stamp from Unix Time into human time in Excel with this formula: =(((B2/60)/60)/24)+DATUM(1970;1;1) B2 is a placeholder for the cell to be converted- Depending on your country settings you might have to convert the decimal format from '.' to ',' (from point to comma). It may be necessary to specify the format of date and numbers columns.
- Than I did my Excel magic
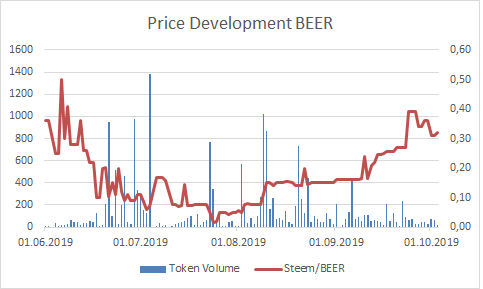
Another graph from @bluerobo

Stay tuned for more information
The team behind this - mainly fun and community orientated - token is working on some tools and will be ready soon.

Prost Santé! Cin cin! Proost! Cheers! Kippis! Kanpai! Kanpai!! Kanpai
This is Not an Investment Advice only some information about a fun token we like to grow to a price of a real beer. Nobody knows if this will work - but it would be damn f#cking cool!
Anyway,
if you like fun and beer and blockchain,
have a look to the BEER token

