
SUMMARY
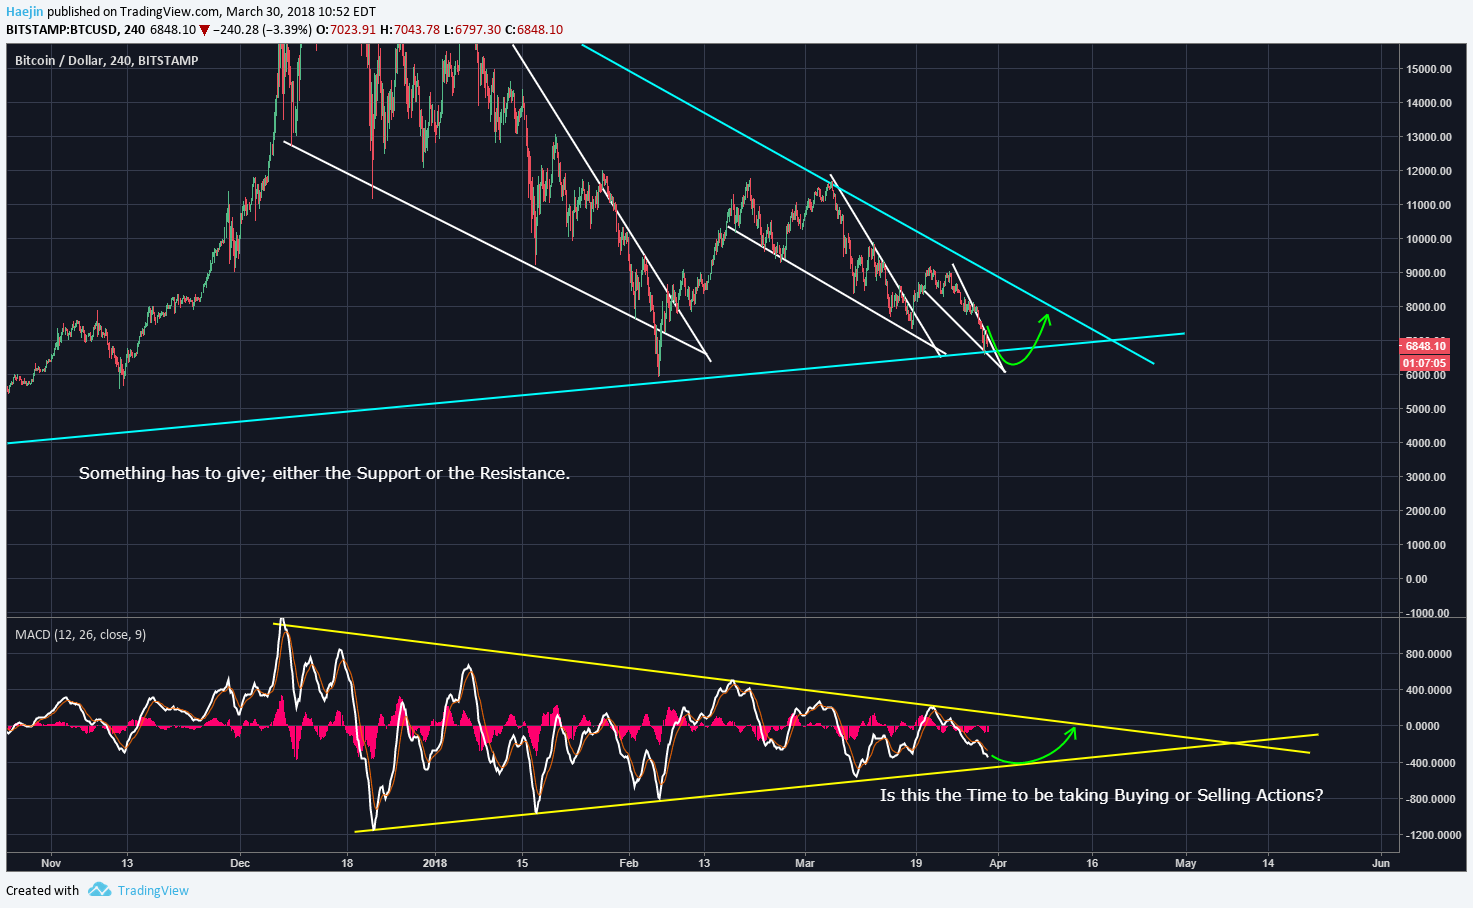
Overnight Bitcoin (BTC) price action went as low as $6,557 which briefly pierced the lower long term support line. Price then came right back into the triangle pattern. I believe that price could go a few price bars below the lower support line and then come back above it. The below chart shows the green arrowed line that shows a potential scenario. The MACD in this 4 hour chart has not touched the bottom yellow line and is likely to do so. The green arrow shows the potential pathway. The yellow bottom line had been touched at all prior occasions and is probable to do this time around as well. This will jive well with the price dipping a few bars below the blue long term support line and then rise above it.
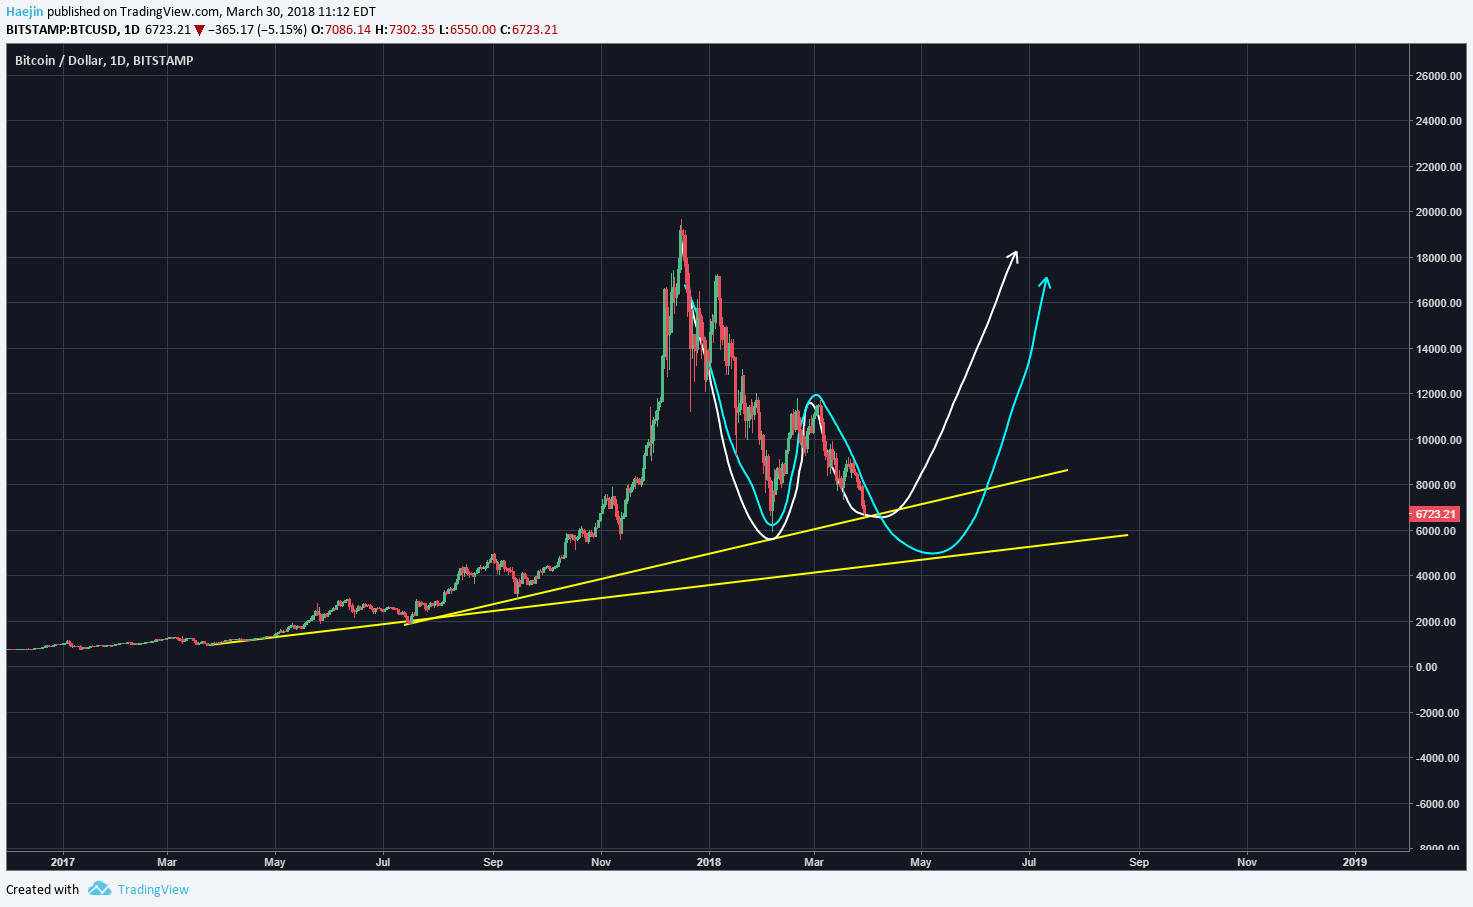
This daily chart is used to show the W cycle bottoming which was discussed in a coupled posts during last week. Recall that the W represents the trough of cycles while the M represents the peak to peak. The while W pathway scenario calls for the first long term support line to provide the base impetus to rise up to potentially new highs. The blue W pathway takes into consideration the possibility that the first support could be breached and thus the second support line is used as the base to provide the slingshot rise. To the Hodler who has a multi-year timeframe and cash available to dollar cost average on this buying opportunities; it matters none which W pathway this correction takes. The video has more details!
Legal Disclaimer: I am not a financial advisor nor is any content in this article presented as financial advice. The information provided in this blog post and any other posts that I make and any accompanying material is for informational purposes only. It should not be considered financial or investment advice of any kind. One should consult with a financial or investment professional to determine what may be best for your individual needs. Plain English: This is only my opinion, make of it what you wish. What does this mean? It means it's not advice nor recommendation to either buy or sell anything! It's only meant for use as informative or entertainment purposes.
Please consider reviewing these Tutorials on:
Elliott Wave Counting Tutorial #1
Elliott Wave Counting Tutorial #2
Elliott Wave Counting Tutorial #3
Laddering and Buy/Sell Setups.
Laddering Example with EOS
Tutorial on the use of Fibonacci & Elliott Waves
@haejin's Trading Nuggets
Essay: Is Technical Analysis a Quantum Event?
Follow me on Twitter for Real Time Alerts!!
Follow me on StockTwits for UpDates!!
--
--