
SUMMARY
On a longer term, there could be a triple decker fractal of inverted Head & Shoulder Bullish pattern in the works. I've referred to this fractal as the mirror image of the H&S Top fractals the correction has gone through.
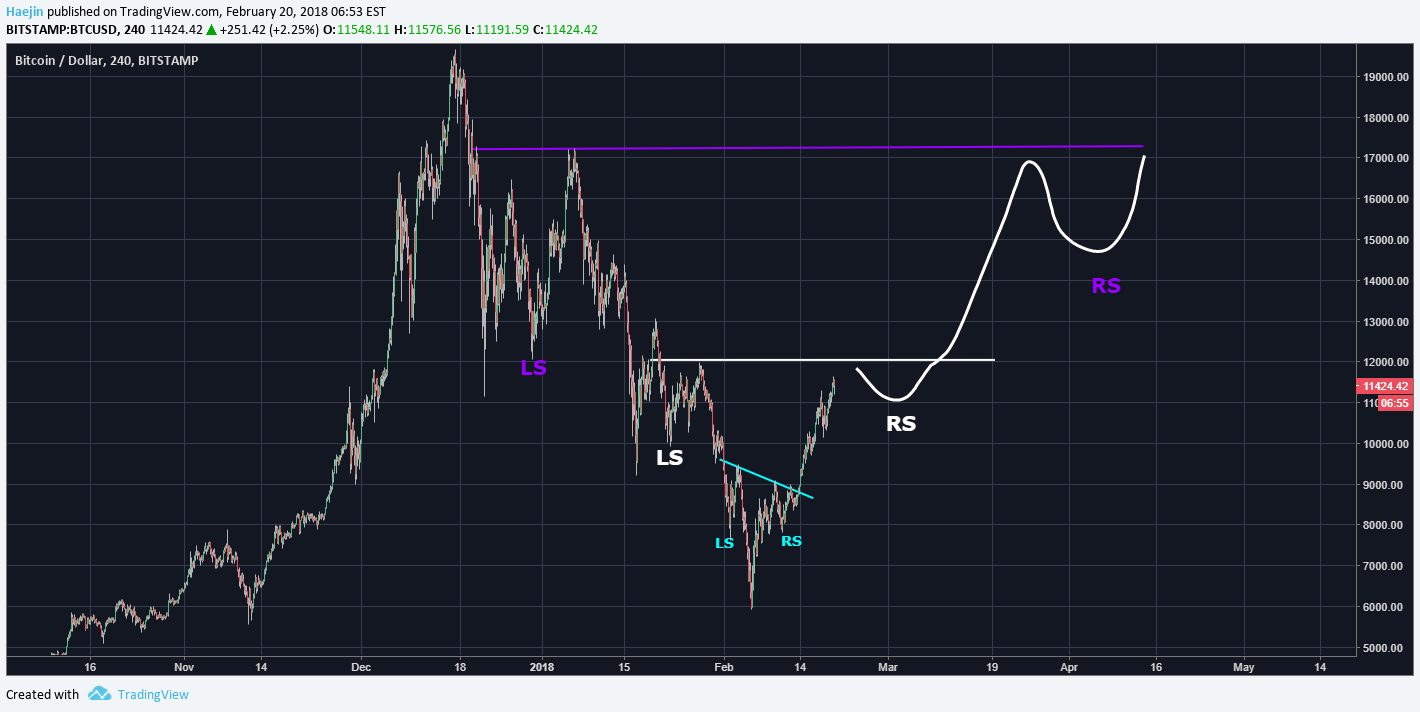
Bitcoin overnight price action has now made the critical junction of around $12,150 that much closer. The below chart shows the next resistance level BTC needs to breach. How it either gets repelled by that level or how it breaches it will be the details I'll keep my eyes one. Thus far, price is departing more and more from looking like a three wave.

The closeups show blue wave iv could be complete and if so, targeting $12k towards the critical junction.
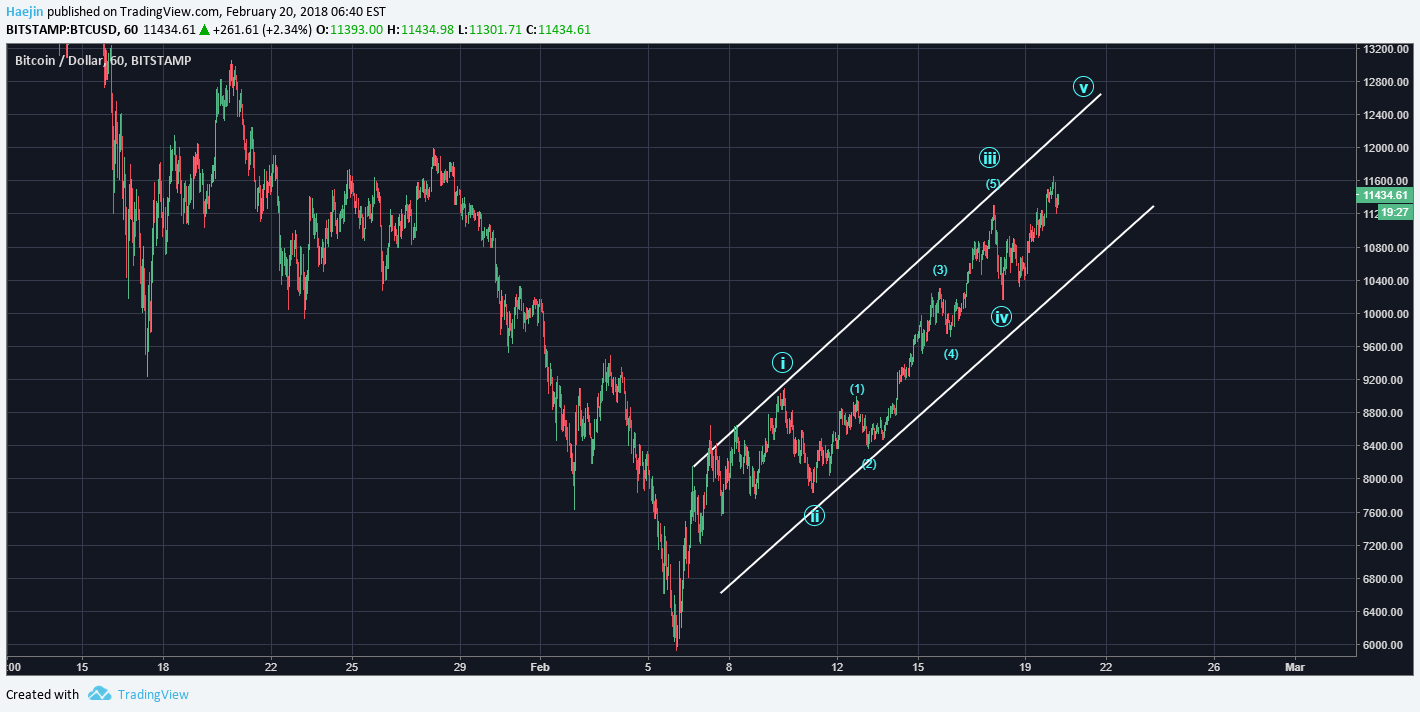
A more bullish count shows that if wave iii is not yet complete, mid $13k would be in the probable picture.

Legal Disclaimer: I am not a financial advisor nor is any content in this article presented as financial advice. The information provided in this blog post and any other posts that I make and any accompanying material is for informational purposes only. It shoud not be considered financial or investment advice of any kind. One should consult with a financial or investment professional to determine what may be best for your individual needs. Plain English: This is only my opinion, make of it what you wish. What does this mean? It means it's not advice nor recommendation to either buy or sell anything! It's only meant for use as informative or entertainment purposes.
Please consider reviewing these Tutorials on:
Elliott Wave Counting Tutorial #1
Elliott Wave Counting Tutorial #2
Elliott Wave Counting Tutorial #3
Laddering and Buy/Sell Setups.
Laddering Example with EOS
Tutorial on the use of Fibonacci & Elliott Waves
@haejin's Trading Nuggets
Essay: Is Technical Analysis a Quantum Event?
Follow me on Twitter for Real Time Alerts!!
Follow me on StockTwits for UpDates!!
--
--