Pic Source
Fibonacci retracement only works in a trending market. The idea is that the prices do not keep rising or falling in a straight line, but make several pauses and pullbacks along the way.
Fibonacci retracement shows you how far the price may pull back once it has paused before continuing in its direction.
So the first thing is to find out if the market is trending. It could be an uptrend or downtrend. The next thing is to wait until there is a pause in the trend and the prices begin to pull back.
Then you should draw the Fibonacci retracement lines starting from the point the trend began to the point the prices hit the highest (or lowest) level they reached before beginning to pull back.
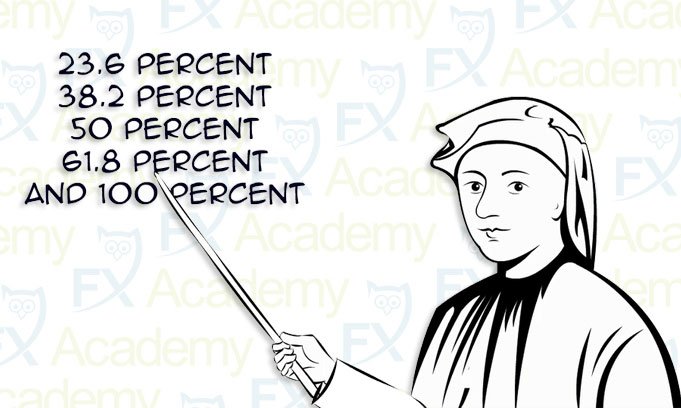
There are 23.6%, 38.2%, 50% and 61.8% and 100% retracement levels. You may have been advised to place your limit order at one of these levels. Don’t do that. You never know whether the trend is taking a pause or is reversing.

Pic Source
Wait until the prices have hit one of these levels and strongly bounced back. If the trend is really strong, the prices usually bounce back from the 23.6% level. If it is not so strong, they bounce back from the 38.2% or 50% level.
 Pic Source
Fibonacci Series / Golden Ratio / Fibonacci Retracement / Bitcoin Trading
You Are Never Left Alone
@lordoftruth

Keep Steem Free From Racism --> More LOVE Energy is Needed.

Time to Buy Steem Power --> HardFork Velocity HF20.

What You Know About --> Syrian Civil War.

If You Are New Steemain Read --> Get Started Fast with Steemit.

Steemit is Beautiful Because of YOU --> Great Support & Generosity.

If You Want To Promote Steemit --> Use Celebrities's Album.

If You Feel Invisible on Steemit --> Come and hang with us.

If You are New in Forex --> Read Forex Education Center / Volume I.


Every comment, every upvote, every support is really appreciated.
Thanks For Reading

