
I have finished my research, and I've found a very accurate and profitable model to forecast the BTC/USD price. It took a lot of time, I have been working on this for at least 3 weeks, and I have shown a few glimpses here and there, but those were only for illustration/educational purposes. This model on the other hand is an investment grade model, it actually gives you a verifiable edge over the market, it has positive expectancy, and it is very very accurate.
In this article I will give you an accurate presentation about my model, and if you are interested, you can contact me, I am willing to sell it, but it won't be cheap, that is for sure. If you are a wealthy trader / fund manager, you should be very excited, this model should send your profits straight 45 degree up.
THE PROFITGENERATOR
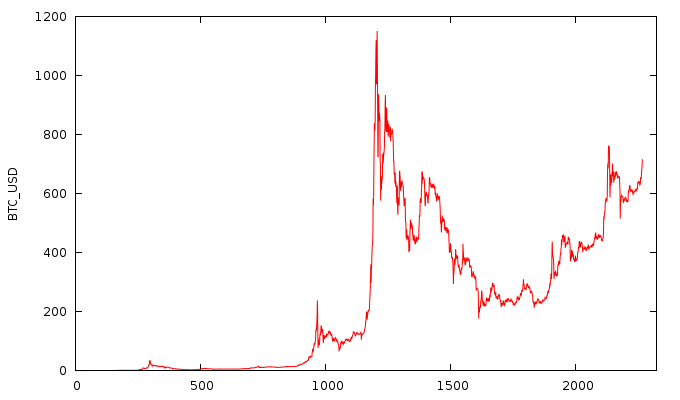
The model is based on Blockchain.info's daily price feed, so you should make sure the exchange you are trading at, is in synch with that data. It is daily CLOSE price, at 00:00 UTC time. It spans from the early days up to recently:
The model is pretty complex and it relies on external information, which is publicly available, for free, so no need to worry about that. I've configured the model and optimized it for this demonstration, but it needs to be re-optimized every time you use it / add new data to it. The coefficients are configured pretty precisely, although I have used a 2-point precision in this analysis, when you do it in real time you should use at least 4.
Let's see the reasons why the model is very accurate:
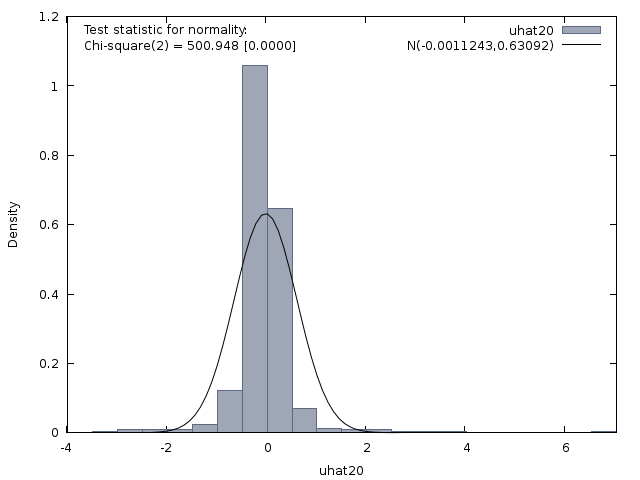
- Residual distribution has short tail:
Chi-square(2) = 500.948 with p-value 0.00000
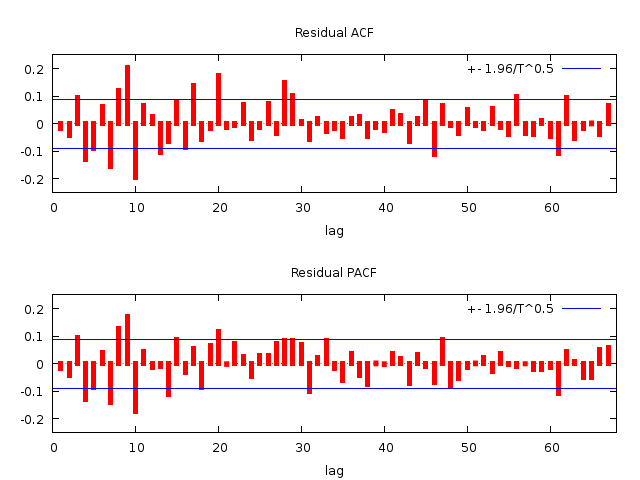
- Residuals not autocorrelated:
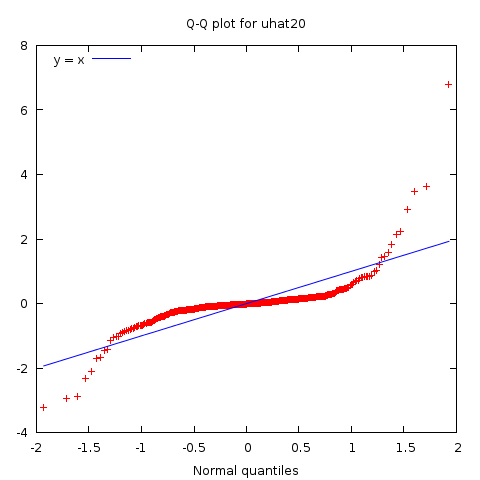
- QQ plot aligned well, despite a small skew
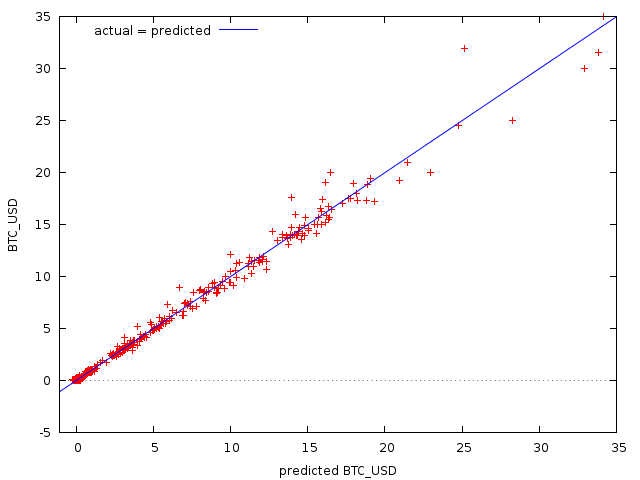
- The Interpolated model fits well on the price
FORECASTS
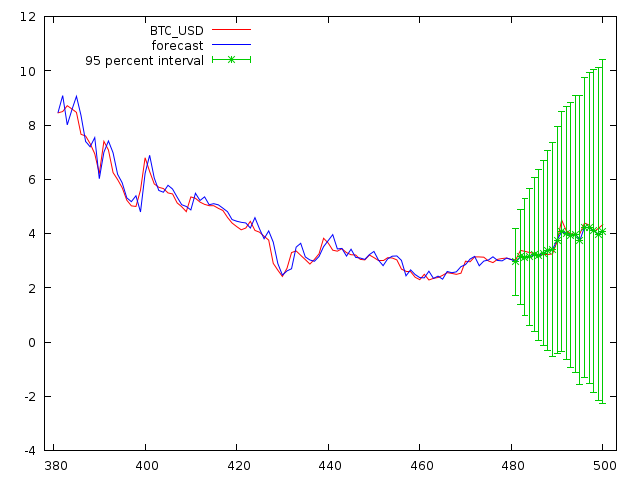
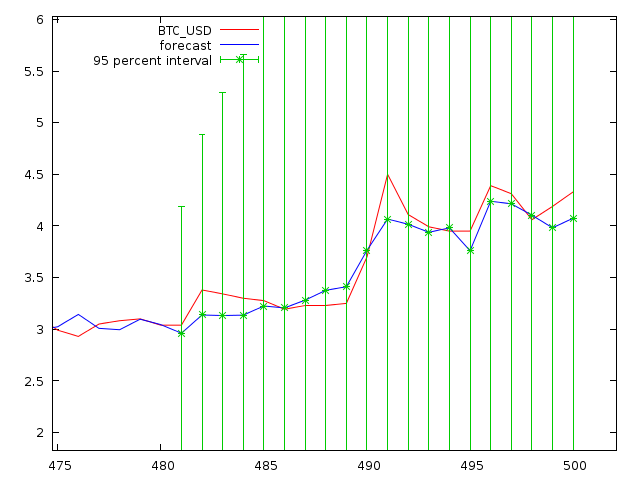
After we know that the residuals are small and random, and that the fitted model fits well on the price, we can forecast it into the future of the past data. I am using static forecasting, which means that it is forecasting step-by-step, after each step update the forecast with the actual value to forecast the next element. This way we can forecast 1 day ahead, very accurately! The forecast starts from the 480'th datapoint which is 2011-Dec-09.
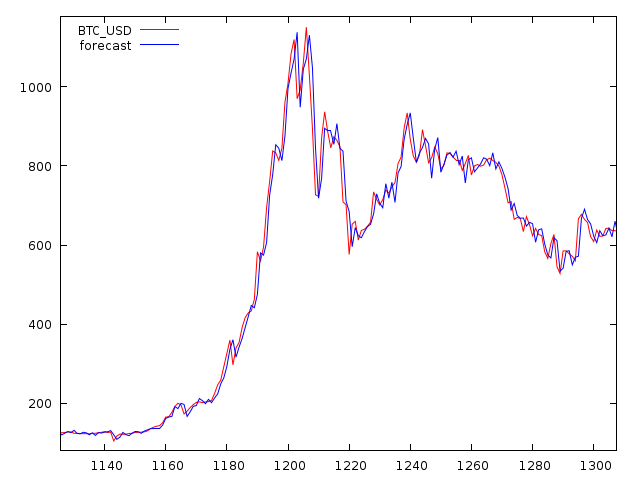
As you can see it's very very accurate with a sample size of 1886, and even if it doesn't forecast the price exactly, it does forecast the direction accurately and it's profitable nontheless. Let's break it down:
| Mean Error | Mean Absolute Error | Mean Absolute Percentage Error | Theil's U |
|---|---|---|---|
| 0.07003 | 8.1117$ | 2.9842% | 0.94762 |
We can see the errors are very small, we have on average a 8.11$ deviation from the actual price, which amounts to a ~3% error. The entropy coefficient or Theil's U shows us that we have a 5.238% edge. If Theil's U is above 1, that means that the model is worse than random guessing, and if it's below 1 it means that we have that amount of edge over random guessing. Therefore our model does have real predictive capacity.
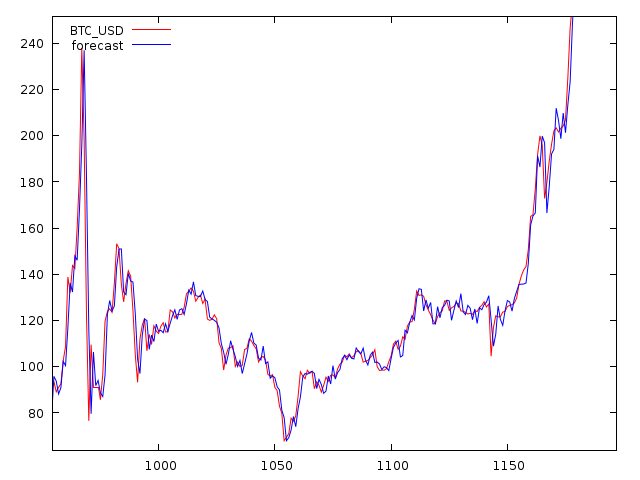
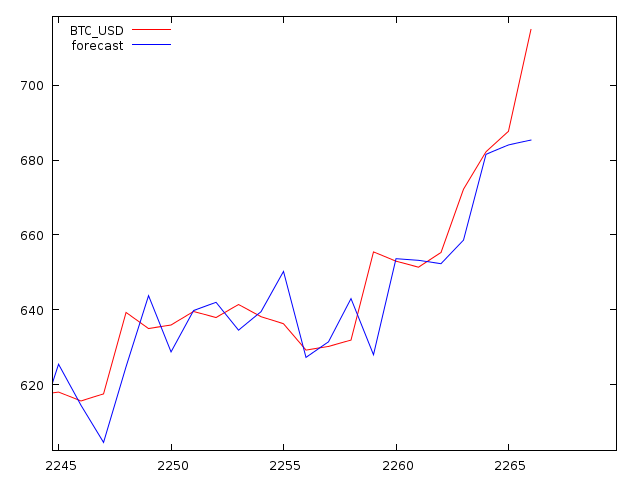
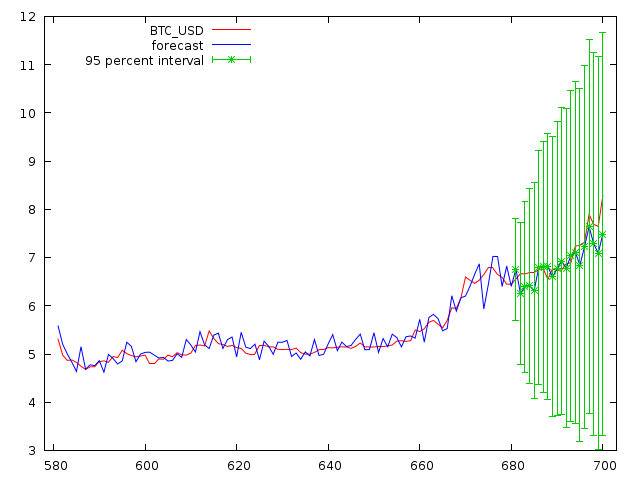
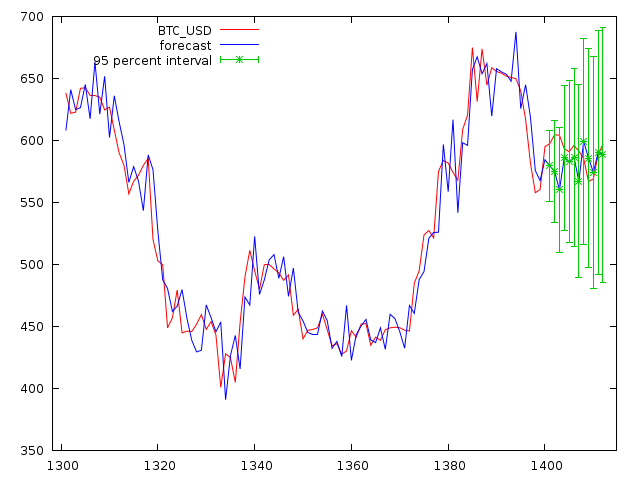
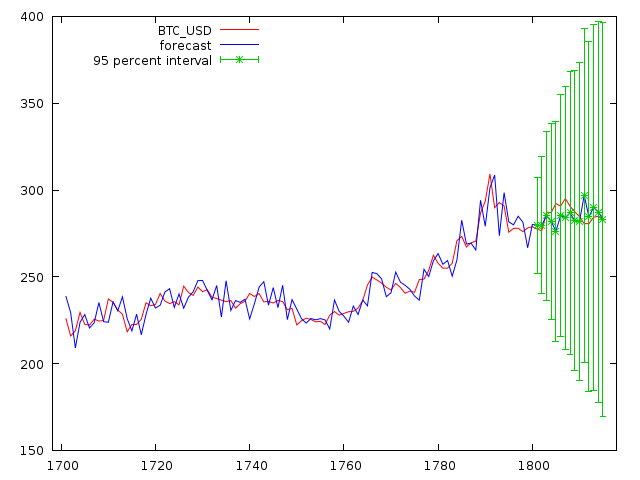
Now let me show you some dynamic forecasts or adaptive forecasts, where we take the forecasted data and predict more than 1 step ahead from that. I will keep it under 10 days into the future, but it's recommended to not use dynamic forecasting, only 1-step-ahead forecasting in real trading for maximum accuracy. However it can still give you an idea about future trend:
| Mean Error | Mean Absolute Error | Mean Absolute Percentage Error | Theil's U |
|---|---|---|---|
| 0.085916 | 0.13703$ | 2.1059% | 0.63721 |
Only a 13 cent error, and a predictive edge over the market of +36%
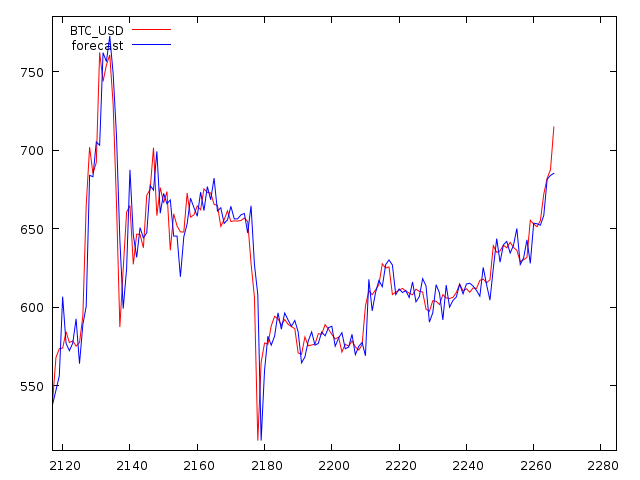
More dynamic forecasts:
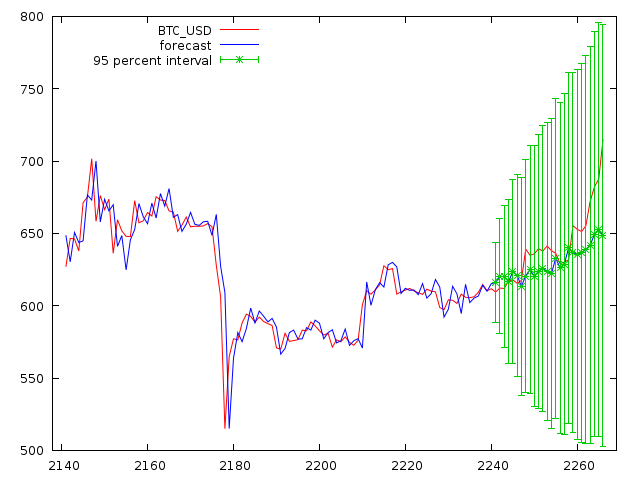
BACKTESTING
After we know how accurate the modeling and forecasting is, let's see how much it actually generates over this period. We have 1886 days of data. I have made a backtest on this forecasted data, by default we use 1:1 leverage, but if you have access to leveraged trading accounts the profit could be way bigger.
| Result | Value |
|---|---|
| Total Days | 1886 |
| Wins (Days) | 1140 |
| Losses (Days) | 746 |
| Win Rate | 60.4454% |
| Expected Value | + 2.9968 $ |
| 1:1 Leverage Profit for 1$ / trade | 5,652.14 $ ( +2.99 $ / day ) |
| 1:1 Leverage Profit for 100$ / trade | 565,214.09 $ ( +299.68 $ / day ) |
| 1:1 Leverage Profit for 10,000$ / trade | 56,521,408.98 $ ( +29,968.92 $ /day ) |
We see that with an average account that is capable of risking 100$/trade, we could generate a profit of 565,214.09 $ over 1886 days, or +299.68 $ profit / day. Very very profitable, looks like my research was very rewarding, I have found the best model for forecasting BTC/USD.
PRICING
I am selling this model, with complete tutorial how to set it up, providing software, and every data tool you need in order to setup this model and start forecasting with it. It should work forever, unless something really massive changes in Bitcoin's design (Segwit won't affect it). I will also provide support for it, so if you have any problems or questions about it, you can contact me anytime and I will explain. The price will be expensive, since this is a real-working investment grade model, but it is negotiable if you have a more reasonable offer.
