When your code has performance bottlenecks, you can use the profiler software to benchmark your code, which will reveal the potential problems in your code or modules (memory or time consuming)
在代码出现性能瓶颈的时候,我们通常使用性能评估软件也就是Profiler 来查看代码中到底是哪几行,或者哪几个模块比较耗资源(速度慢或者占内存)。
Recently, my Profiler told me that I wrote a few lines of useless code.
最近我就用 Profiler 跑了一下,发现我写了几处无用的代码。具体如下:
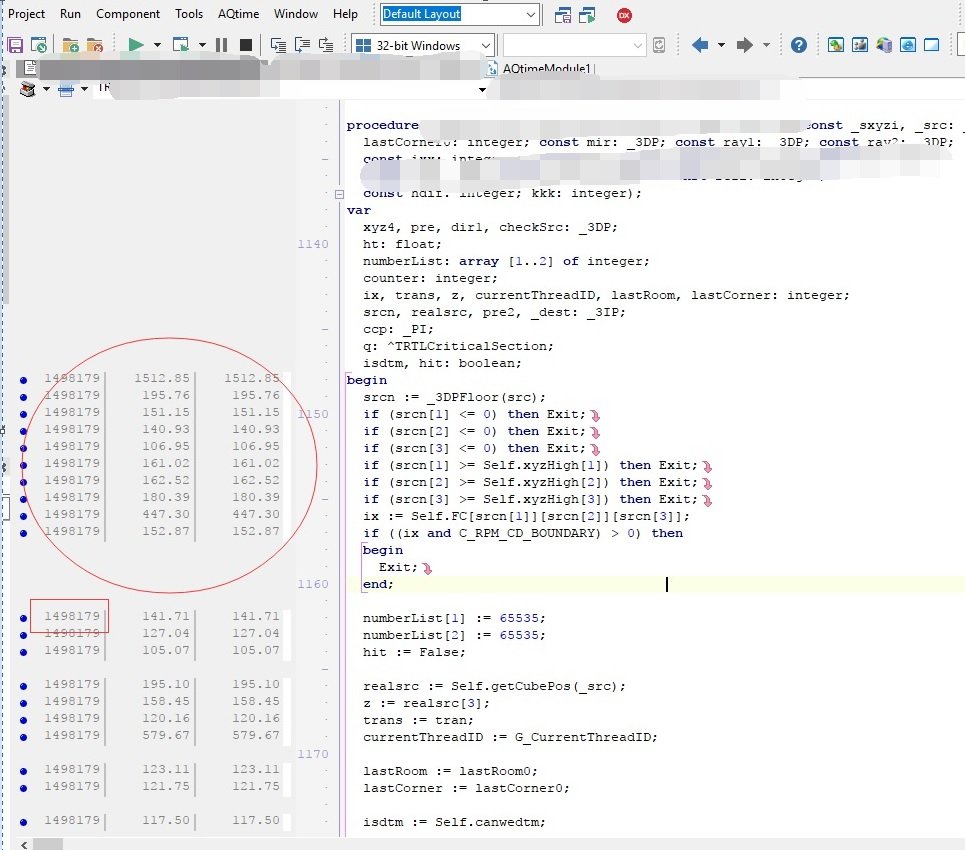
As seen in the screenshot, the leftmost numbers are calling counters, the middle columns are time in milliseconds, and the rightmost columns are also time but with the sub-routines. Those lines are safety checks to prevent the crash due to possibly out-of-range errors.
每行代码左边那个数字是被调用的次数,中间是执行时间(毫秒),右边是子函数的执行时间。我红色标出来的执行次数都是 1498179,而在进入这个函数的前几行都是在判断,如果条件不符合就立马退出函数,避免继续往下执行而导致程序崩溃(数组访问越界等)。
Obviously, the statistics show that these exit conditions are never met. Removing these save 2-3 seconds execution time. The method of adding safety checks (e.g. check object for null), are often seen as a way to handle the exception softly. Some might argue that it is a way to hide the errors. It is always better to throw the exceptions as early as you can instead of hiding them, because they will eventually come back to bite you in the as*.
但是明显来说,这几行代码都没有起作用。删掉这几行代码能省下2-3秒的执行时间。其实这种编程风格是 “Defensive Programming" 也就是处处加些判断(比如判断对像是否为 null)而不让程序崩溃。但实际上并不推荐,因为最好是一遇到错误就立即抛出异常,这样可以让我们更早的知道潜在的问题,而不是隐藏错误。

Originally published at https://steemit.com Thank you for reading my post, feel free to Follow, Upvote, Reply, ReSteem (repost) @justyy which motivates me to create more quality posts.
原创 https://Steemit.com 首发。感谢阅读,如有可能,欢迎Follow, Upvote, Reply, ReSteem (repost) @justyy 激励我创作更多更好的内容。
近期热贴 Recent Popular Posts
- 中年大叔还有梦可以做么?
- Code Review Series - Value Not Used [坑爹的代码] - 变量未使用
- 步子迈太大容易扯到蛋
- A Better Voting Strategy with Back Tracking Algorithm - 通过回溯算法确定更好的点赞策略
- Code Review - Reinventing the Wheel 代码审核之 重新造轮子
- Simple Method to Insert Math Equations in SteemIt MarkDown Editor 如何在 SteemIt MarkDown Editor 里添加数学公式?
- The Best Upvoting Strategy Calculator in Javascript - 怎么样点赞收益最高? (新老用户都来看看)
- How to Use Steem API/transfer-history and IFTTT to sync to Slack? 如何使用Steem API/transfer-history和IFTTT同步到Slack消息?
- SteemIt API/transfer-history 最简单获取帐号钱包记录的API
- 第一次打肿脸充胖子 - 花了200STEEM租1万SP四周!
- API steemit/account 简单封装了一下 steemit/account 的 API