In the past I've used javascript for some projects, but I have been meaning to learn how to use Node.js for some more client/server type stuff. The recent controversy on the chain has drawn some attention to dApp and blockchain tool development, and that made me think that it might be interesting to investigate the Steem apis. Another aspect of the controversy is that it has been about “distribution”, but it seems to me that people often talk about this in a very hand-wave-y way, even though it could easily be a very data-focused discussion given that it's all available in the blockchain. So my thought is that trying to write a tool to help visualize some of this data would be a good way for me to learn how to use Node.js and the Steem apis, and if it works well it might be useful as people discuss the past, present, and future of the blockchain.
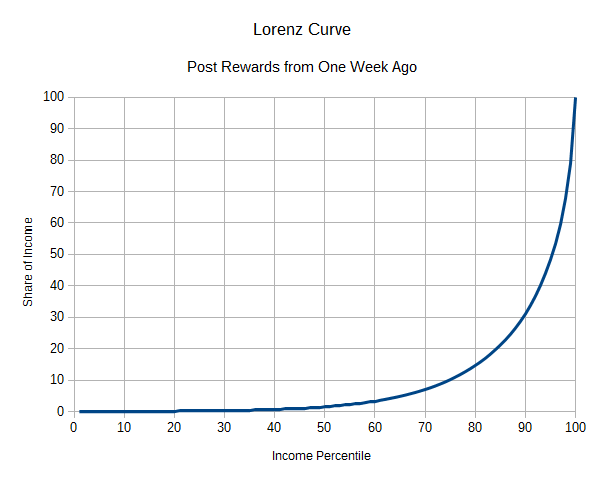
Eventually my hope is to develop a robust tool that generates its own pretty charts on a variety of measures, but as an initial task to get started I settled on trying to generate the Lorenz curve of post rewards for a week's worth of posts. In traditional economics, one way that people try to analyze distribution of resources is with the Lorenz curve. It's usually used for income, since in real-world economies that's usually easier to measure than wealth. On the X axis you plot the income percentile, and on the Y axis you plot the share of income that goes to that percentile. So for example, if the lowest-income 10% of a population earned 2% of the combined income of the entire population, you would plot that at point (10, 2). Since a percentile includes everything below it, this will give you an upward sloping curve. If the population was totally equal then you'd get a straight line, since the bottom 10% would get 10% of the income, the bottom 50% would get 50%, etc. If the population was very unequal, you'd get almost zero for most percentiles, and then it would shoot up to 100% at the end when you get to the handful of people who get everything. (One aspect of Steem that will make analyses of this type difficult is that there isn't a one-to-one correspondence between accounts and people, either for good reasons like having a personal account and an account for a project or business, or for bad reasons like running a network of spam accounts).
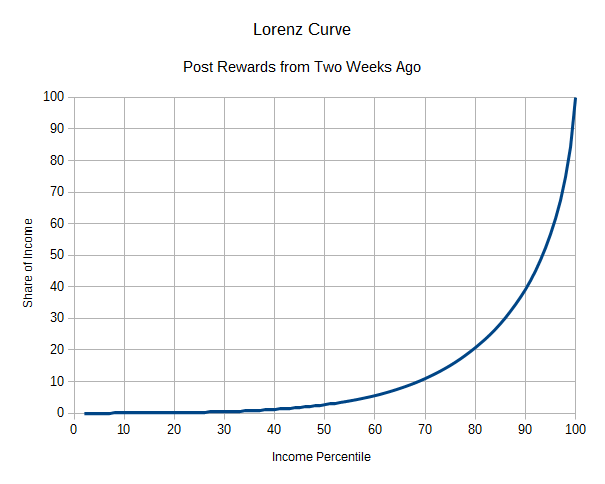
Right now the script just spits out the data into a CSV file, which I imported into LibreOffice to make the charts below. I'm not sure that there's a ton of insight to draw from these, except to note that things seem more skewed toward the top end last week than they were a week before that.
Eventually I'm hoping to expand this to take into account things like beneficiaries, curation rewards, rewards from comments below the top level, etc., since I think that is all potentially interesting, as well as looking at SP distribution rather than just income. Personally I am interested in seeing if there are any noticeable changes over time, and whether they correspond to the various changes that have been implemented in the system. I'm including the code below, but be aware that it's not very elegant since I'm still in a learning phase.
const fs = require('fs');
const dsteem = require('dsteem');
const client = new dsteem.Client('https://api.steemit.com');

const oneWeek = 7*24*60*60*1000; // number of milliseconds in a week.
var payoutSum = 0;
var payouts = {};

queryLoop(1);

function initializeCount() {
  payoutSum = 0;
  payouts = {};
}

function analyzePost(post) {
  var reward = post.total_payout_value.toString().split(/\s+/);
  if (reward[1] != "SBD") {console.error("Don't know what", reward[1], "is");}
  reward[0] = parseFloat(reward[0]);
  if (reward[0] > 0) {
    if (typeof payouts[post.author] === 'undefined') {
      payouts[post.author] = reward[0];
    } else {
      payouts[post.author] += reward[0];
    }
    payoutSum += reward[0];
  }
}

function generateStats(week) {
  console.log("Start generating stats for week", week);
  var authors = Object.keys(payouts);
  authors.sort((a,b) => {return payouts[a] - payouts[b];});

  var outputHack = "";
  var numberOfAuthors = authors.length;
  var peopleAccountedFor = 0;
  var rewardsAccountedFor = 0;
  var previousPercentile = 0;
  authors.forEach(author => {
    peopleAccountedFor++;
    rewardsAccountedFor += payouts[author];
    incomePercentile = (100*peopleAccountedFor/numberOfAuthors).toFixed(2);
    fractionOfIncome = (100*rewardsAccountedFor/payoutSum).toFixed(2);
    if (incomePercentile >= (previousPercentile+1)) {
      outputHack += incomePercentile+','+fractionOfIncome+"\n";
      previousPercentile = Math.floor(incomePercentile);
      console.log("Accounted for first", previousPercentile, "percentile");
    }
  });

  if (outputHack != "") {
    fs.writeFile("week"+week+".csv", outputHack, (err) => {console.error(err);});
  }

}


async function queryLoop(stopAge) {
  var currentTime;
  var weeksAgo = 0;
  var query = {
    tag: '',  // tag to query
    limit: 1, // number of posts to return
    truncate_body: 1, // limit body of post to 1 char, since we don't need it
  };

  // fetch first record, so we have a jumping-off point for the loop.
  var runQuery = await client.database.getDiscussions('created', query)
  .then(result => {
    result.forEach(post => {
      currentTime = new Date(post.created);
      query.start_author = post.author;
      query.start_permlink = post.permlink;
      query.limit = 51;
    })
  });

  totalPostsQueried = 0;
  var previousWeek = 0;
  while (weeksAgo < 3) {
    runQuery = await client.database.getDiscussions('created', query)
    .then(result => {
      totalPostsQueried += 50;
      console.log("Processing results to", totalPostsQueried);
      result.forEach(post => {
        if (post != result[result.length-1]) {
          weeksAgo = (currentTime - new Date(post.created))/oneWeek;
          if(Math.floor(weeksAgo) != previousWeek) {
            // we crossed into a new week, dump stats for previous week.
            generateStats(previousWeek);
            initializeCount();
            previousWeek = Math.floor(weeksAgo);
          }

          analyzePost(post);
        } else {
          // skip processing last element, since next query will fetch it.
          query.start_author = post.author;
          query.start_permlink = post.permlink;
        }
      })
    })
  }

  return runQuery;
}