A couple weeks ago, I posted Steem post promotion: Past, present, and future. For that post, I had to track down the post, Introducing Promoted Content.

Pixabay license, source
And while searching for that, I came across the post of interest for today, Supply of Steem Decreasing! which was posted six days before I joined in July, 2016. I'm not sure if I saw the post at the time or not, but if I did, it had slipped my mind.
In the post about Steem's supply decreasing, @dan made a sort of hand-waving argument that the Steem supply was decreasing because the "virtual supply" went down, and that happened because they had recently printed 350 thousand SBDs.
It struck me as odd that a blockchain can be constantly producing new tokens, burning nothing, and still be deflationary - even in the short term. On the other hand, I had previously observed this exact phenomenon with the circulating supply from coinmarketcap.com (see here). So, knowing that @dan was one of the founders, of course I believed this claim, but I wanted to understand it better.
To that end, I've been playing around with PowerBI and steemdb.io for the last couple weeks, and I think I understand it better now.
If I understand it, it goes something like this:
The "current supply" of Steem is about 407 million, and the "current supply" of Steem Dollars is about 11 million. We need to remember, however, that those two values are connected. In point of fact, the Steem Dollar represents one dollar's worth of debt, which is redeemable from the blockchain by "converting" an SBD to the equivalent amount of STEEM.
Therefore, the "virtual supply" is the total amount of STEEM plus the total value of SBDs in terms of STEEM (with SBDs valued at $1, not at external market prices).
So that means the "virtual supply" of STEEM would be equal to this formula:
virtual_supply == current_supply (STEEM) + ( current_sbd_supply / price of STEEM )
At today's price of about $0.27, this means that the virtual supply is:
407 million + ( 11 million / 0.27 ) =~ 407 million + 41 million =~ 448 million.
(obviously, all figures are rounded for purposes of simplicity)
The crux of @dan's argument was that - all else being equal - when the STEEM price in the denominator of the second term goes up, the virtual supply necessarily goes down (and the same happens in reverse). Basically, any time the price of STEEM increases at a rate that outpaces inflation, the blockchain will be deflationary. Here's how he phrased it:
Steem Dollars give the entire network leverage and amplify the gains (and losses) of those who hold STEEM and Steem Power.
So all of that is presented as background for understanding the following graph, which justifies the claim in the headline:
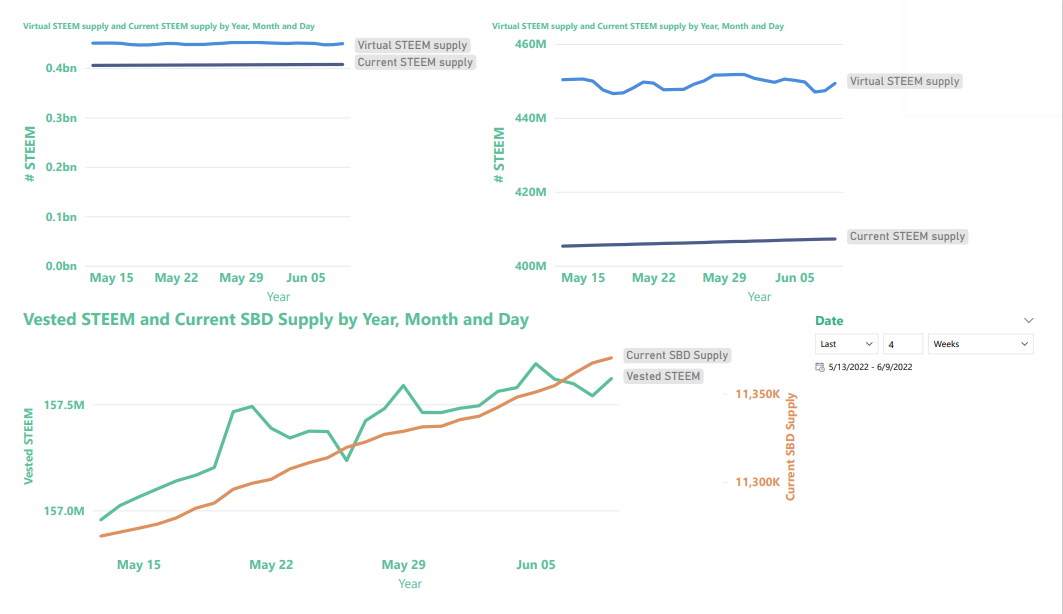
As can be seen by squinting carefully at the graph in the top-right corner, when we account for both STEEM and SBDs, the Steem blockchain really has been deflationary during the last 4 weeks. According to steemdb.io and as shown above, four weeks ago the virtual supply of STEEM stood at 450,358,059 and today it was measured at 449,361,803.
The same mechanism also means that when we burn SBDs, that act of retiring the debt is exactly equivalent to burning a certain number of STEEM ( number of burned SBDs / price of STEEM ). At today's price, each SBD that gets burned is equivalent to burning [ 1 / 0.27 ] =~ (3.7) STEEM.
If we burn SBDs for post promotion, all this gives us an interesting little rule of thumb which hadn't occurred to me before:
The lower the price of STEEM, the more impact post promotion can have on the overall supply. (and vice versa)
Left as an exercise to the reader -- The blockchain reports its "current_supply" on the order of 407 million and its "virtual supply" on the order of 450 million. So, how do coinmarketcap.com and coingecko.com derive their circulating supply figures, in the neighborhood of 395 million? I have a theory, but first I'd like to hear your ideas.