Hi everyone, as promised in my introduction, here is my first post from my endeavors in the realm of Blockchains and such:
I bought into the Cryptocurrency world some time ago. Besides investing in the big established currencies such as Bitcoin, I also tried chasing the one new coin on the Blockchain to rule them all. Not that I succeeded and do not have to work anymore, but instead I ended up with a rather scattered portfolio of many different coins and tokens. This turns out to be cumbersome to manage. I even failed to answer the most simple question: How much are my investments currently worth? I had no idea, just a rough estimate from looking at CoinMarkteCap and trying to remember how much I own of some of the listed currencies.

Of course, there are already apps that help you manage such an investment mess like Blockfolio. However, there is some evidence that this app in particular likes to share a lot of your precious information; a rather unpleasant side effect, especially in the realm of Crypto where privacy is probably more valued than anywhere else.
So why not build your own Cryptocurrency Blockfolio? It turns out that this is straightforward using IPython in combination with the pandas library and plotly for visualizations. Moreover, the pricing data can be obtained from the CoinMarketCap API for free. This is all we need. I created an IPython notebook that does this for you and is available on my Github profile.
How does the notebook work?
Just download it, unpack it, run jupyter notebook in the same folder, and you can easily calculate your crypto assets' net worth.
Let’s dive into it and let me give you a quick tour through the notebook. First, we do need a very few imports and make plotly ready to work in the notebook environment:
import pandas as pd
import plotly.offline as py
import plotly.graph_objs as go
py.init_notebook_mode(connected=True)
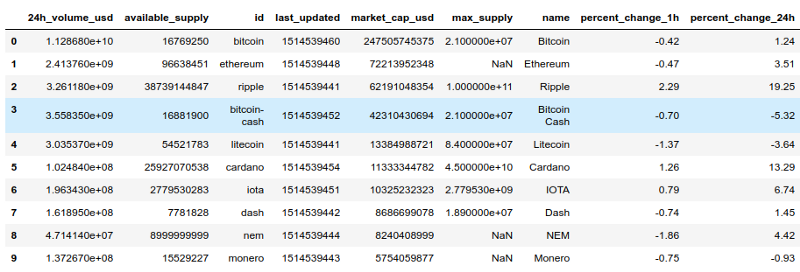
Next, we load the data directly from CoinMarketCap. See how nicely pandas processes the API call for us and turns the resulting JSON into a DataFrame:
limit = 200  # only load the top 200 currencies
coin_market_cap_api = 'https://api.coinmarketcap.com/v1/ticker/?limit={}'.format(limit)

# load the data using pandas and keep track of the time
now = pd.datetime.now()
market_data = pd.read_json(coin_market_cap_api)
market_data.head(10)

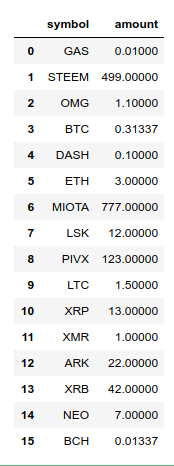
Now comes the key part of the notebook, your own Blockfolio. Simply add your assets' symbols, as given on CoinMarketCap, and the amounts you own to the Python dictionary:
# enter your coins below:

block_folio = {
    'BTC': 0.31337,
    'BCH': 0.01337,
    'ETH': 3,
    'LTC': 1.5,
    'MIOTA': 777,
    'XRP': 13,
    'DASH': 0.1,
    'XMR': 1,
    'LSK': 12,
    'OMG': 1.1,
    'XRB': 42,
    'PIVX': 123,
    'ARK': 22,
    'NEO': 7,
    'GAS': 0.01,
    'STEEM': 499,
}

# display your blockfolio
block_folio = pd.DataFrame(list(block_folio.items()), columns=['symbol', 'amount'])
block_folio.head(len(block_folio))

This turns your data into a frame as given above. Just to be clear, this is toy data I made up and by no means my real crypto portfolio or even an investment advice! Next, we need to combine the amount of Cryptos with the corresponding pricing data from CoinMarketCap:
# merge the API and blockfolio data and sort by investment value
merged_data = block_folio.merge(market_data, how='left')
merged_data['value_usd'] = merged_data.amount * merged_data.price_usd
merged_data['coinshare'] = merged_data.amount / merged_data.available_supply
merged_data = merged_data.sort_values('value_usd', ascending=False)
By merging 'left' we ensure that only data of coins we own is kept. We calculate the value of each coin as well as our "coinshare" (I’ll come back to that one later).
Let's see what we have!
To get our net worth in US Dollar we simply need to sum over the new column value_usd:
networth = 'Your blockfolio is currently (i.e {}) worth {:.2f} USD!'.format(now.strftime('%Y-%m-%d %I:%M %p'),
                                                                        merged_data.value_usd.sum())
print(networth)
And there we have it: "Your blockfolio is currently (i.e 2017–12–30 12:44 PM) worth 14039.27 USD!"
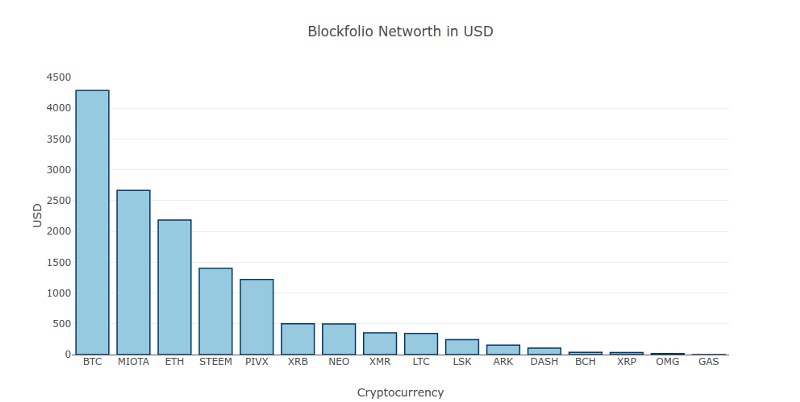
Moreover, we can nicely visualize the share of each Crypto asset using plotly. Let’s first sort according to the value and display this as a bar chart:
marker = dict(color='rgb(158,202,225)',
              line=dict(color='rgb(8,48,107)', width=1.5))

layout = go.Layout(title='Blockfolio Networth in USD',
                   xaxis=dict(title='Cryptocurrency'),
                   yaxis=dict(title='USD'))

value_chart=go.Bar(x=merged_data.symbol, y=merged_data.value_usd, marker=marker)
fig = go.Figure(data=[value_chart], layout=layout)
py.iplot(fig)

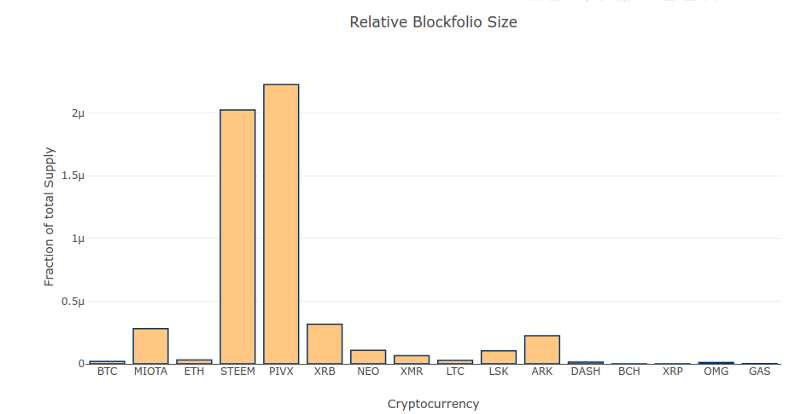
Finally, above we also calculated something that I termed "coinshare". This is the fraction of the coin’s or asset’s total available supply that you own. This reflects basically how much you bet on the relative coin’s success. The higher the value, the more you should hope that the coin gains in value. The one with the largest share is basically your top horse in the crypto race. In this example, let’s hope that PIVX, the proof-of-stake fork from DASH, and, of course, STEEM will race to the moon:
marker = dict(color='rgb(258,202,125)', line=dict(color='rgb(8,48,107)', width=1.5,))

layout = go.Layout(title='Relative Blockfolio Size',
                   xaxis=dict(title='Cryptocurrency'),
                   yaxis=dict(title='Fraction of total Supply'))

share_chart=go.Bar(x=merged_data.symbol, y=merged_data.coinshare, marker=marker)
fig = go.Figure(data=[share_chart], layout=layout)
py.iplot(fig)

That’s it for now, enjoy your new Python Blockfolio. Again, checkout the full notebook at my Github profile and happy HODLing!
