Hey folks!
Different day, same shift! I've used this punchline before. How's everything going? I hope everyone of you had a great time during the weekend! I took the time to enjoy nature this weekend. A new week is an opportunity for a new beginning though! Okay, I hate Mondays and Tuesdays... It's been a wonderful but rather exhausting day so far, however I'm back in business with another Engineering blog. No time to waste though, so let's get this started! Oh, no...
This time I'd like to take the chance to create an introductory post about Cartography, which is the scientific field of creating and building maps through the utilization of spatial information. It is the science of extracting precise geographic information by accurately constructing and properly reading maps. Cartography is also considered the art of simplifying and simulating the geographical environment as well as demonstrating spatial relations between broader areas.
As I mentioned, this is an introductory post so I will just share general information regarding the scientific field of creating accurate representations of our 3D world on a 2D piece of paper. This time we will be discussing the objective of cartography as a scientific field. I will also share information regarding the different basic characteristics of maps, so stay focused! Is anyone there?

Image Source: pixabay.com
Objective
This specific scientific field serves the purpose of reducing a surface's spatial characteristics and demonstrating analyzed geographic information in the form of a presentation that is easily understood by the average user with the utilization of maps. Cartography's main objective is to make all sorts of spatial information available regarding our planet's surface and its spatial characteristics noticeable. It is worth noting that this exact process in not unilateral, which basically means that there are cases in which geographic entities are actually magnified in order to become visible, especially in small scale maps. Even though the application of such methods as a sole activity cannot be considered cartographic, it is undoubted that the end product is an image which in many cases can be considered a map. As a result, just like human speech and writing are in fact basic tools of advanced communication and expression, maps are actually tools which can be used to expand one's field of vision and let them collect information about large geographical entities or even microscopic particles and the correlation between them.
However things are complicated. Even the simplest maps are way more sophisticated than just a plain reduction of size. Maps are meticulously designed tools created and utilized for the observation, registration and further comprehension of the correlation between geographic entities, with the fundamental function of making spatial information visible and precise. Nowadays there's a huge variety of maps being used by military and political authorities for the registration of important events or the surveillance of military forces etc. All maps serve the purpose of enhancing the observer's geographical perception and offering knowledge that would otherwise remain hidden out of sight. Ever since humanity started observing the natural geographical environment, the ways and methods of registering and analyzing spatial information have been advancing dramatically. Different fields of expertise were born mainly due to the fact that Cartography combines various scientific fields, as a result many different ways and methods of building maps serving various purposes by using specific techniques emerged and started being broadly used.

Moscow from above./ Image Source: pixabay.com
It is important to always keep in mind that the objective of all maps is always the same; all maps serve the purpose of defining and demonstrating the shape and correlation of continuous geographic entities. Let's also not forget that the cartographic methods and techniques used are theoretically identical, even in cases where maps of the same geographic entity look totally different due to their initial design of serving different purposes. For instance a map that was built in order to help Engineers register the different sorts of land use regarding a topographic surface should provide the accurate demonstration of the shape of the ground, the residential distribution, the road network, the geological composition etc, whereas a map built to help tourists roam the streets of a city would definitely provide different sorts of information and would therefore emphasize on different spatial correlations. Needless to say the precision demanded in the design and engraving of any kind of construction premises the production of accurate maps for the accomplishment of a successful and safe conclusion.
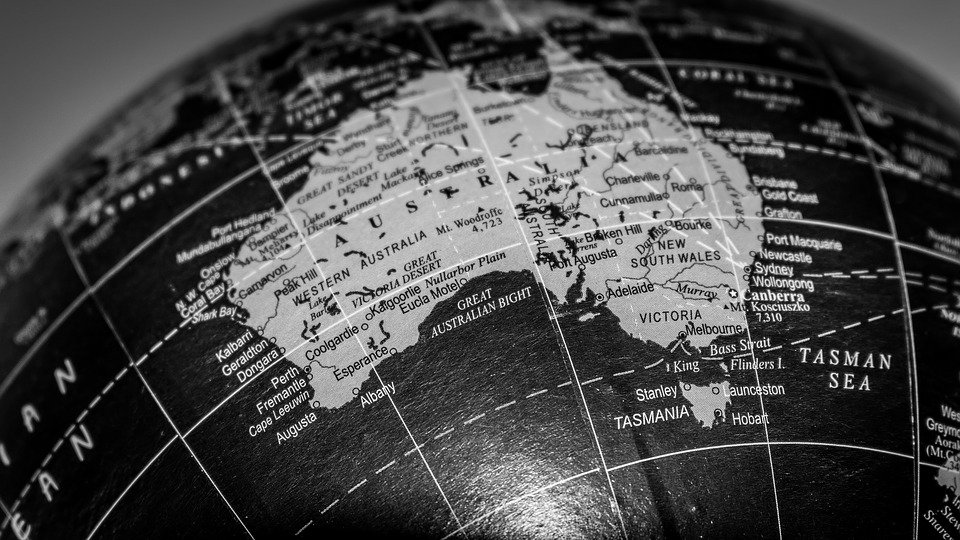
Image Source: pixabay.com
Cartography is a significant section of Engineering Graphics, as this specific scientific field provides Engineers with the opportunity and ability to process, analyze and formulate beliefs, ideas, shapes and correlations between those geographic entities efficiently. It is safe to say that Cartography as a scientific field is directly related with all sorts of activites with the purpose of presentation and therefore the utilization of maps is a top priority issue in Engineering. The first thing to do when facing a problem is to map it. By mapping a phenomenon we can make more accurate observations and design the most efficient course of action according to the desired possible outcome. This induces a need for a deeper understanding of the fundamentals of Cartography and Geometry and the acquisition of practical skills needed for the correct and precise extraction of the information included in maps. The observer can make even more precise and safe assumptions by possessing knowledge of the process of collecting, analyzing and classifying data and information that is utilized in order to design and build a map.
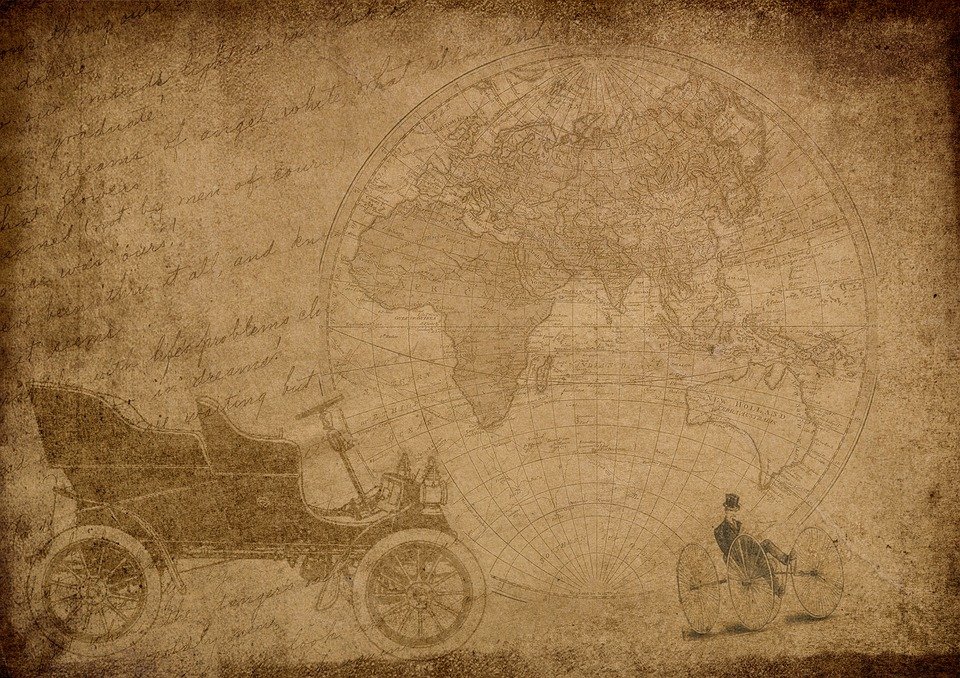
Image Source: pixabay.com
Basic Characteristics of Maps
There's a huge variety of different sorts of maps, providing observers with information regarding the purpose they were designed to serve. For instance maps used on television in weather forecast presentations are totally different than maps used by tourists for navigation or sightseeing. However, even in cases of totally different maps built for rather unrelated reasons, there are some fundamental similarities regarding the nature and objective of mappings as well as the scientific approach taken in order to include geographic information with precision. All maps deal with two different aspects of reality: geographic entities' location and characteristics. Geographic location is a measurable quantity which can be calculated accurately with the use of coordinates that refer to a 2D surface in particular in Cartography. Regarding characteristics, they can be classified in two broader categories: qualitative and quantitative characteristics. It is worth noting that those two aspects of reality that are mainly studied and utilized in Cartography create four basic categories of spatial relations between geographic entities and qualitative or quantitative characteristics, as demonstrated below:
Spatial relations between geographic locations that include no reference to any sort of characteristics, such as the measurement of distances or the definition of geographic directions regarding navigation.
Spatial relations between different characteristics of the same geographic entity by utilizing observations regarding mainly non-continuous attributes, such as weather phenomena or types of soil and substrates.
Spatial relations that define the variation of specific characteristics' values in various geographic locations, such as the alteration of the height of rainfall mainly due to topography.
Spatial relations that are used to describe and define correlations of distribution between different geographic locations, such as the average income earned per person in a specific area.
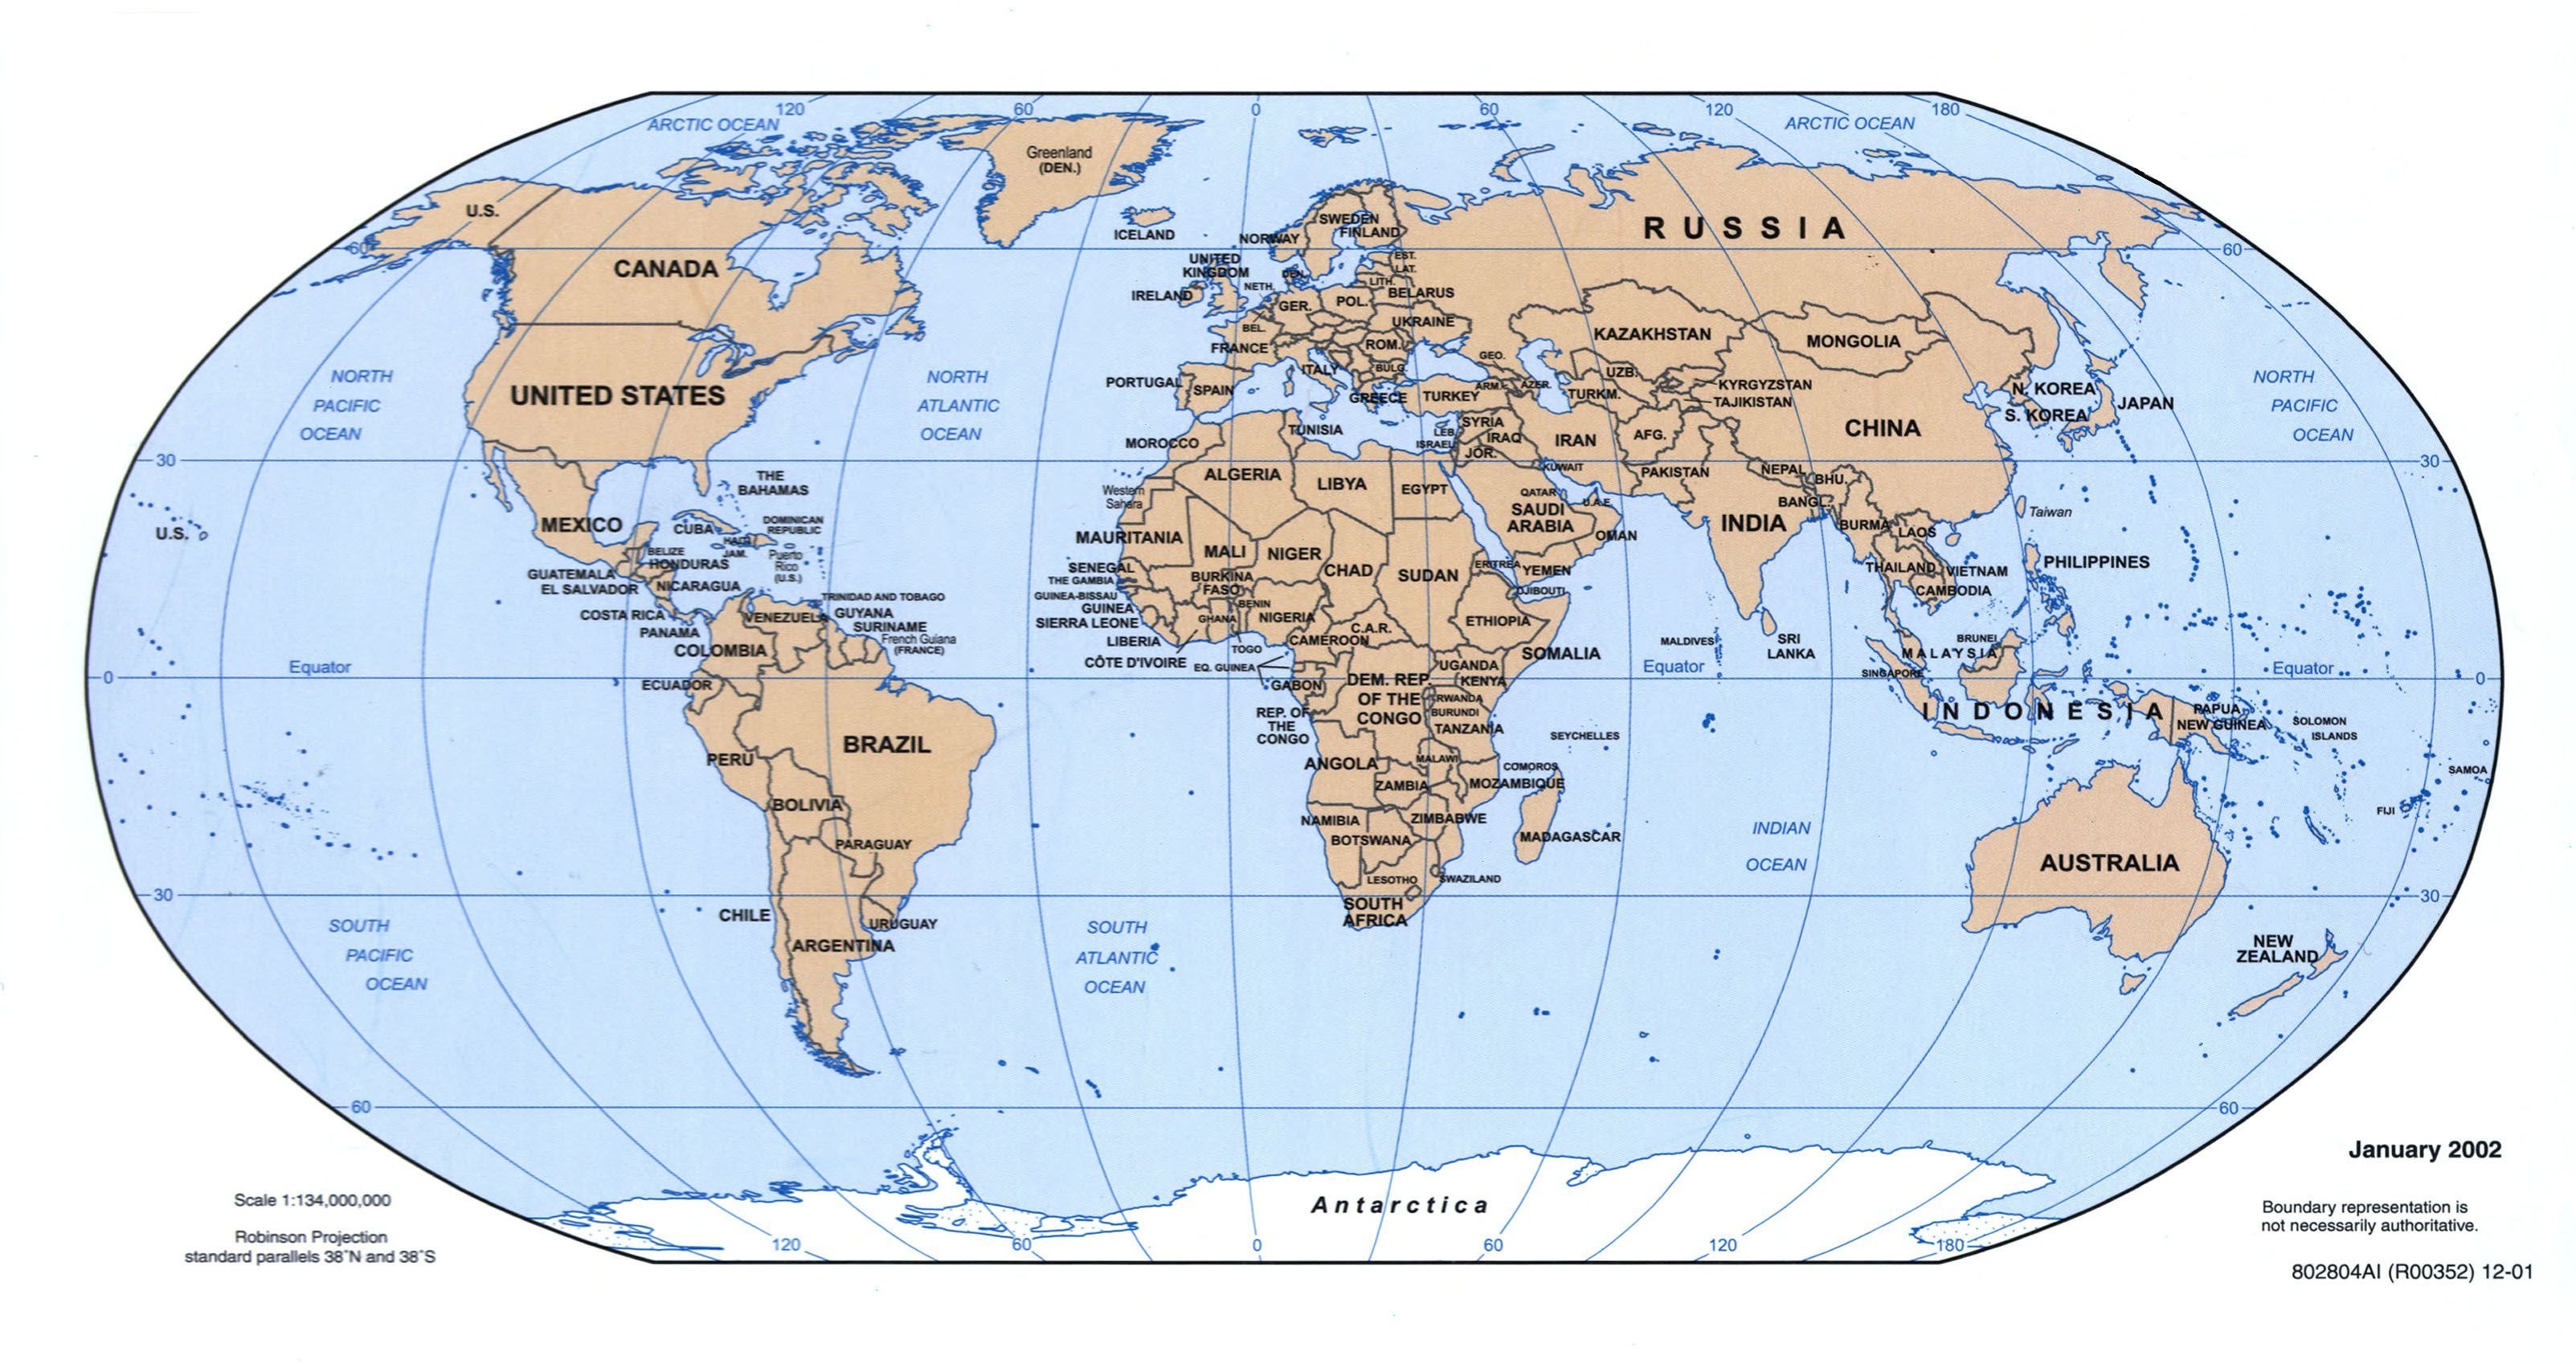
CIA Political World Map 2002./ Image Source: commons.wikimedia.org
All sorts of topological attributes concerning spatial relations can be identified, measured and calculated and therefore maps are powerful tools designed to enhance and provide accurate spatial analysis. All geographic maps are in fact intended to be reductions of reality and as a result maps are obviously small compared to the geographic areas depicted. There are specific dimensional analogies between reality and maps, which are expressed through the use of a scale. As a result, there are limitations regarding the volume of information that can be stored and demonstrated on a map due to its limited and comparatively small size. It is safe to say that the map scale determines the volume of information that can be practically included. Furthermore, the design and creation of maps induces the need for the utilization of precise geographic transformations, which are mathematical formulas through the use of which Engineers can project a 3D object on a 2D surface with satisfactory accuracy. This sort of sytematic transformation is commonly referred to as topographic projection.
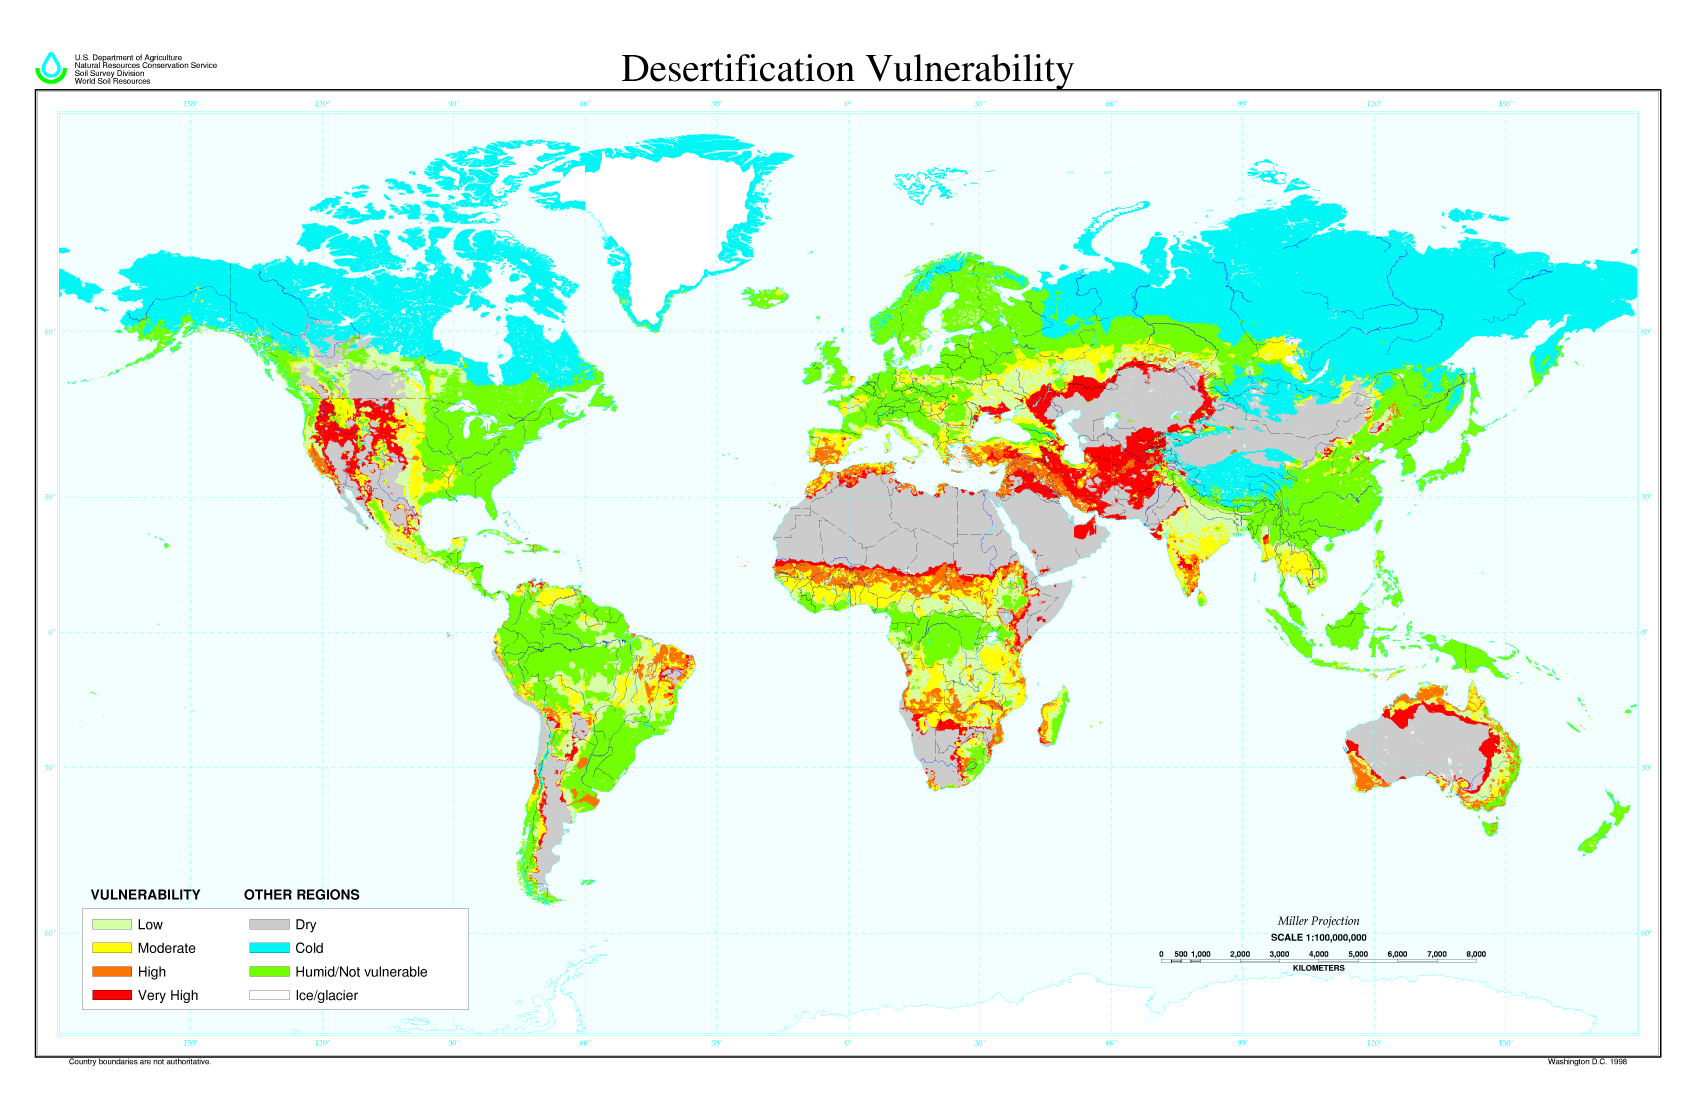
Desertification Vulnerability Global Map./ Image Source: commons.wikimedia.org
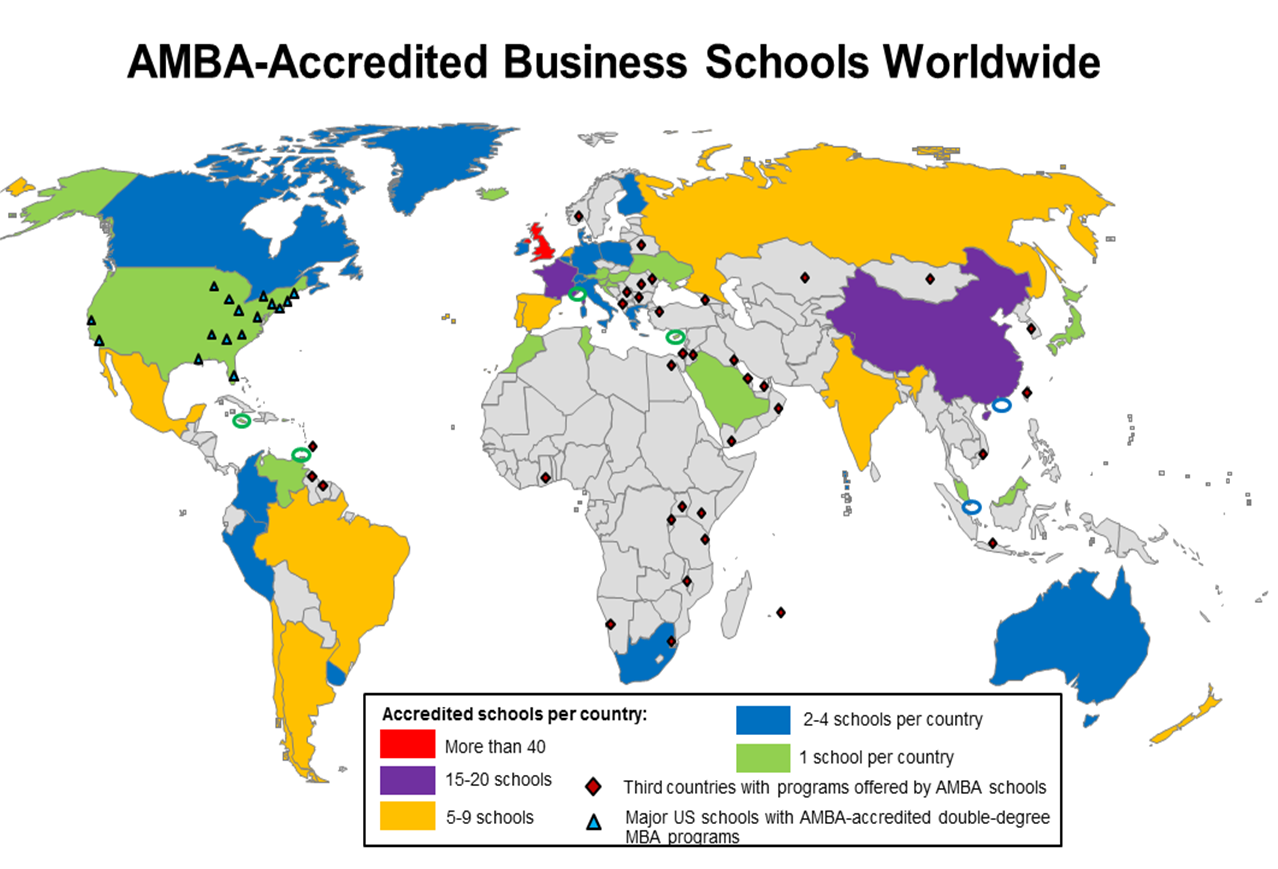
AMBA Accredited Business Schools Global Map./ Image Source: commons.wikimedia.org
It is rather obvious that the proper selection of the cartographic projection affects the way a map can be utilized. Isn't it? Engineers often use cartographic reference systems which are also known as flat coordinate systems mainly due to the fact that they can be utilized for the calculation of distances on the 2D mapping surface. Not what you thought, flat-Earthers, go away! Needless to say, a reference system's precision is always relevant to the cartographic projection utilized. Let's always keep in mind how all maps are actually simplified simulations of the real world though. The 3D space is so complicated and full of information that it is absolutely inevitable to exclude massive amounts of information while creating a depiction of reality, as the creation of an identical model of the real word would demand such large volumes of information to be demonstrated that it would only complicate things further and therefore fail to communicate and provide the observer with geographic information. Thus, every map is in fact meticulously designed and built in order to deliver specific sorts of information which have been selected as appropriate for the map's purpose and have been classified and simplified to be easily comprehended.
It is also worth keeping in mind that all maps utilize special signs which refer to specific characteristics of reality in order to accomplish an advanced and precise depiction of the real world for the observer. The meaning behind those unique signs is certain and all signs are meticulously designed and placed. Cartographic Symbolization is not necessarily global, meaning that symbols used by Engineers in building maps might differ in various places of the Earth with the exception of a few international signs that are broadly used all over the globe. Αll symbols and signs used in building maps are mainly comprised of graphical elements, such as lines, dots and patterns. That said, a user should always try to extract information by comparing the symbols observed to the ones included in the map memo board, which is usually placed in one of the map's corners and is meant to provide detailed information regarding the map symbols. Graphical elements affect the map's readability irrespective of the way they are placed and demonstrated on a 2D piece of paper or a computer screen. Here's another fun map for those of you who actually made it this far.
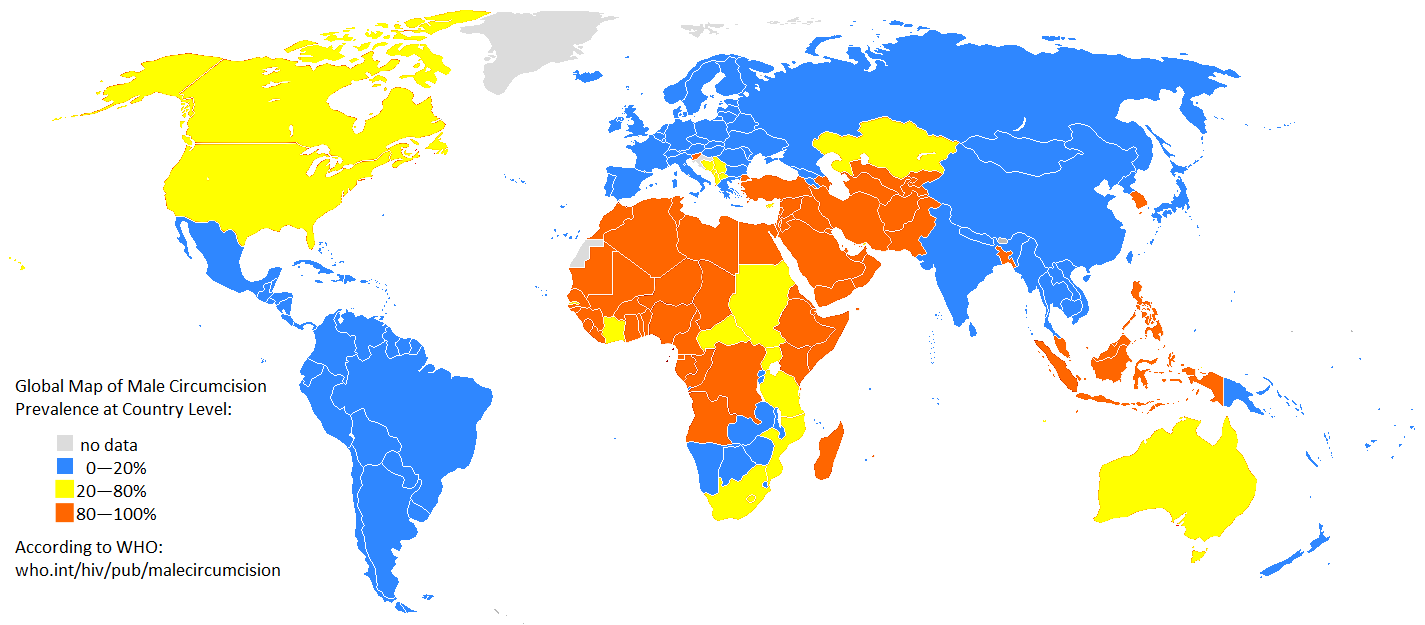
Global Map of Male Circumcision Prevalence./ Image Source: commons.wikimedia.org
That's it for today guys! Hope everyone of you made it till this point. I will definitely create a trilogy regarding this Introduction to Cartography series in order to make things as simple as possible. I will keep trying to approach business in a humoristic manner to prevent boredom from killing anyone reading these blogs of mine! These posts are introductory however they might start getting a bit more nerdy, so stay tuned and follow me at your own risk. Thanks for reading! :)

IMAGE SOURCES:
REFERENCES:
University Textbooks & Course Lectures:
Χαρτογραφία Ι / Cartography I - TSOULOS LYSSANDROS (National Technical University of Athens, School of Rural and Surveying Engineering, Course Lectures)
Xαρτογραφία ΙΙ / Cartography II - NAKOS BYRON (National Technical University of Athens, School of Rural and Surveying Engineering, Course Lectures)
Στοιχεία Χαρτογραφίας, Πανεπιστημιακές Εκδόσεις Ε.Μ.Π. / Εlements of Cartography, University Publications NTUA - ROBINSON, MORRISON, MUEHRCKE, KIMERLING, GUPTILL (National Technical University of Athens, School of Rural and Surveying Engineering, University Textbook.)
Internet Links:
https://www.esri.com/training/catalog/596e584bb826875993ba4ebf/cartography./
https://study.com/academy/lesson/what-is-cartography-definition-history.html

Thank you for your attention!
Hope you enjoyed this post and did learn a thing or two.
Follow me and stay tuned for more engineering blogs.
Highest Regards
@lordneroo