There is another amazing EOStalk contest! This time the contest is about making a good technical analysis and be as close as posssible to the price of EOS next week. Prizes are WhaleShare tokens that you can use to summon a whale that will upvote whatever you want. 1 token is 1% upvote!
Join the WhaleShares discord for more information
https://discord.gg/zsdWYQX
I would like to say that this is not an endorsement to make any trades from this analysis and everything is just for fun. :)
I was trading forex before I met cryptocurrencies. I still sometimes come back and check the market and trends. I tried a lot of indicators and methods how to trade, but only few things worked for me. Ichimoku Kinko Hyo, market structures and Japanese candlesticks such as hanging man or doji. The more you are on the market without indicators that can only make predictions, the better for your money!
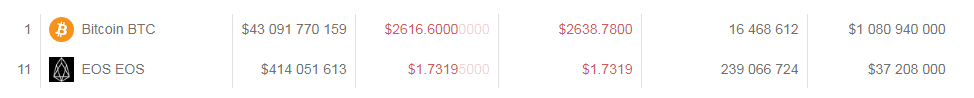
To make a correct technical analysis you need a proper graph. A lot of people will be probably using graphs from coinmarketcap as the site is very popular, but you will not really read anything from a graph like this. That is really not enough for some analysis of the market, mostly just for checking the price and the trend. You can't even add tools into it or change the line to candles.
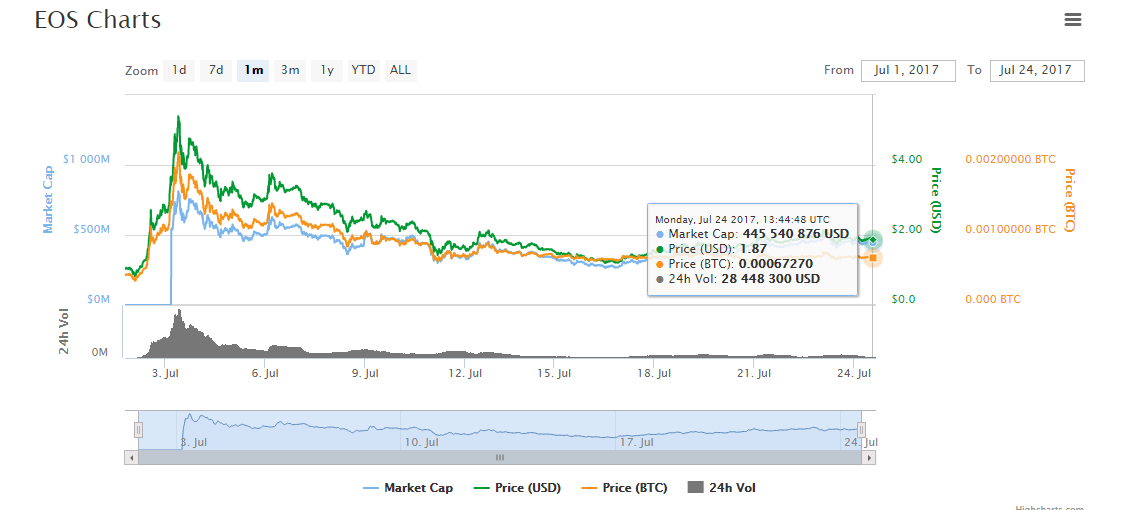
So I had to look for other graph solutions. There was Kraken exchange, cryptocompare and many more. They were still not good enough.
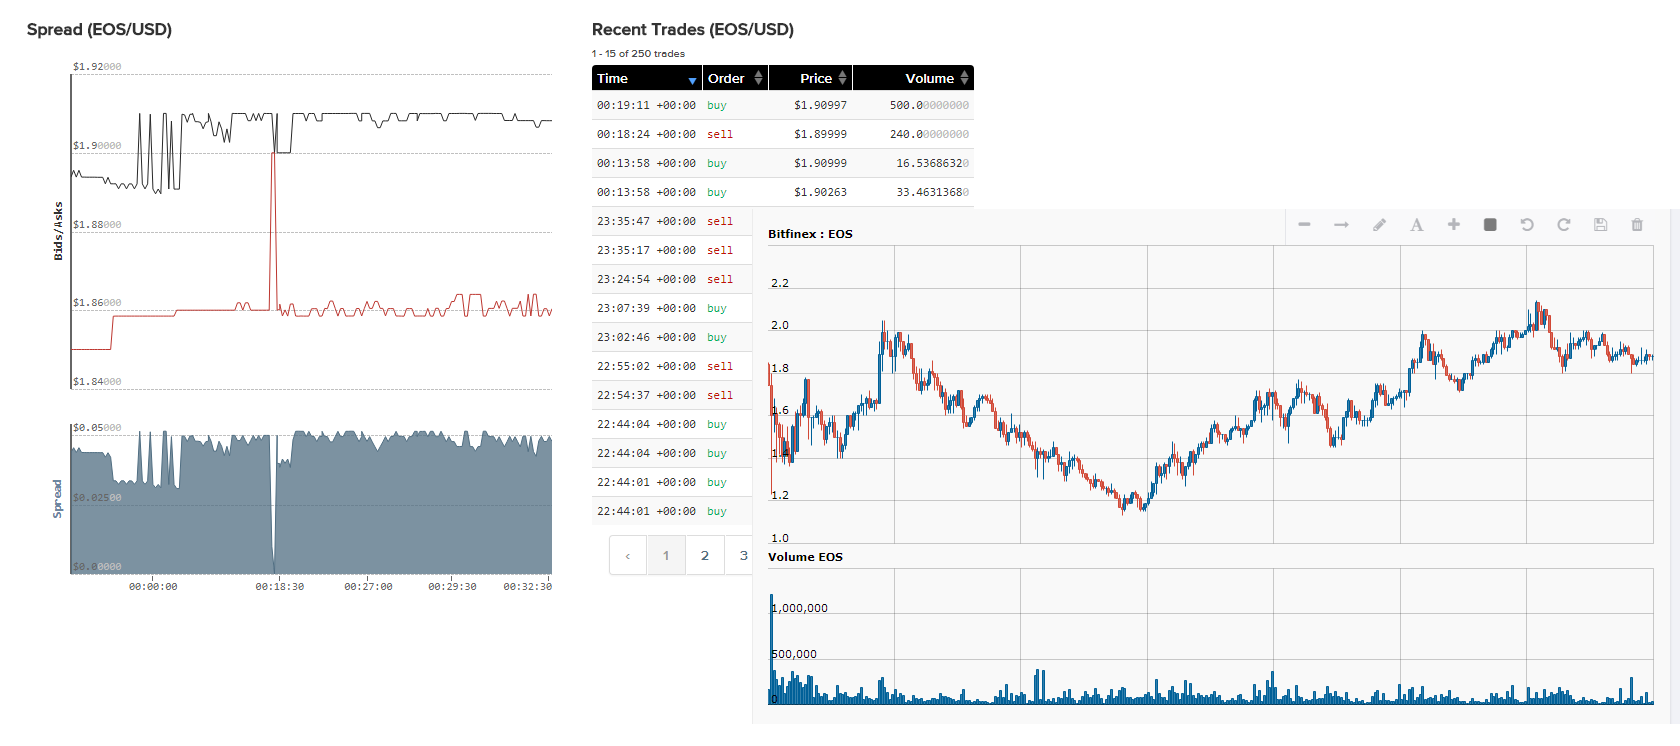
The best graphs I have found were on Bitfinex. They are charts from TradingView, really great site. It doesn't matter if you are looking for forex, stocks, indexes or cryptocurrency graphs, they have it all!
So we have a proper graph with indicators and tools we need to make an analysis now..
What is important to know is that everything is rotating around the price of Bitcoin. We can say that Bitcoin is the main currency of crypto and if it fall, all cryptos fall. However that is maybe too drastic. Few days/weeks ago there were huge down trends just because, in simplicity, Bitcoin had problems. Some of them were fixed with BIP91 and now we can see all the coins flourish. Initialy USAF was the plan for 1st August but it seems that current BIP91 lock-in made it obsolete. Nothing is sure yet. If everything goes according to plan Bitcoin will not lose any value on August 1 and will go towards 4000$ thus every other coin will follow. EOS is also a really good that could even beat Ethereum. We also know that Dan Larimer is a wizard and visionary and he knows how to make good projects - BitShares, Steem. This one will be even bigger thus I really think that the price can't really stay down for long. We don't see huge surges for EOS right now mostly because the ICO is for one whole year.
But this is the problem with fundamental analysis. Without graph you are looking for a very long term investing rather than trading and I need to know the price of EOS for the next week. So let's take a look at the technical analysis.
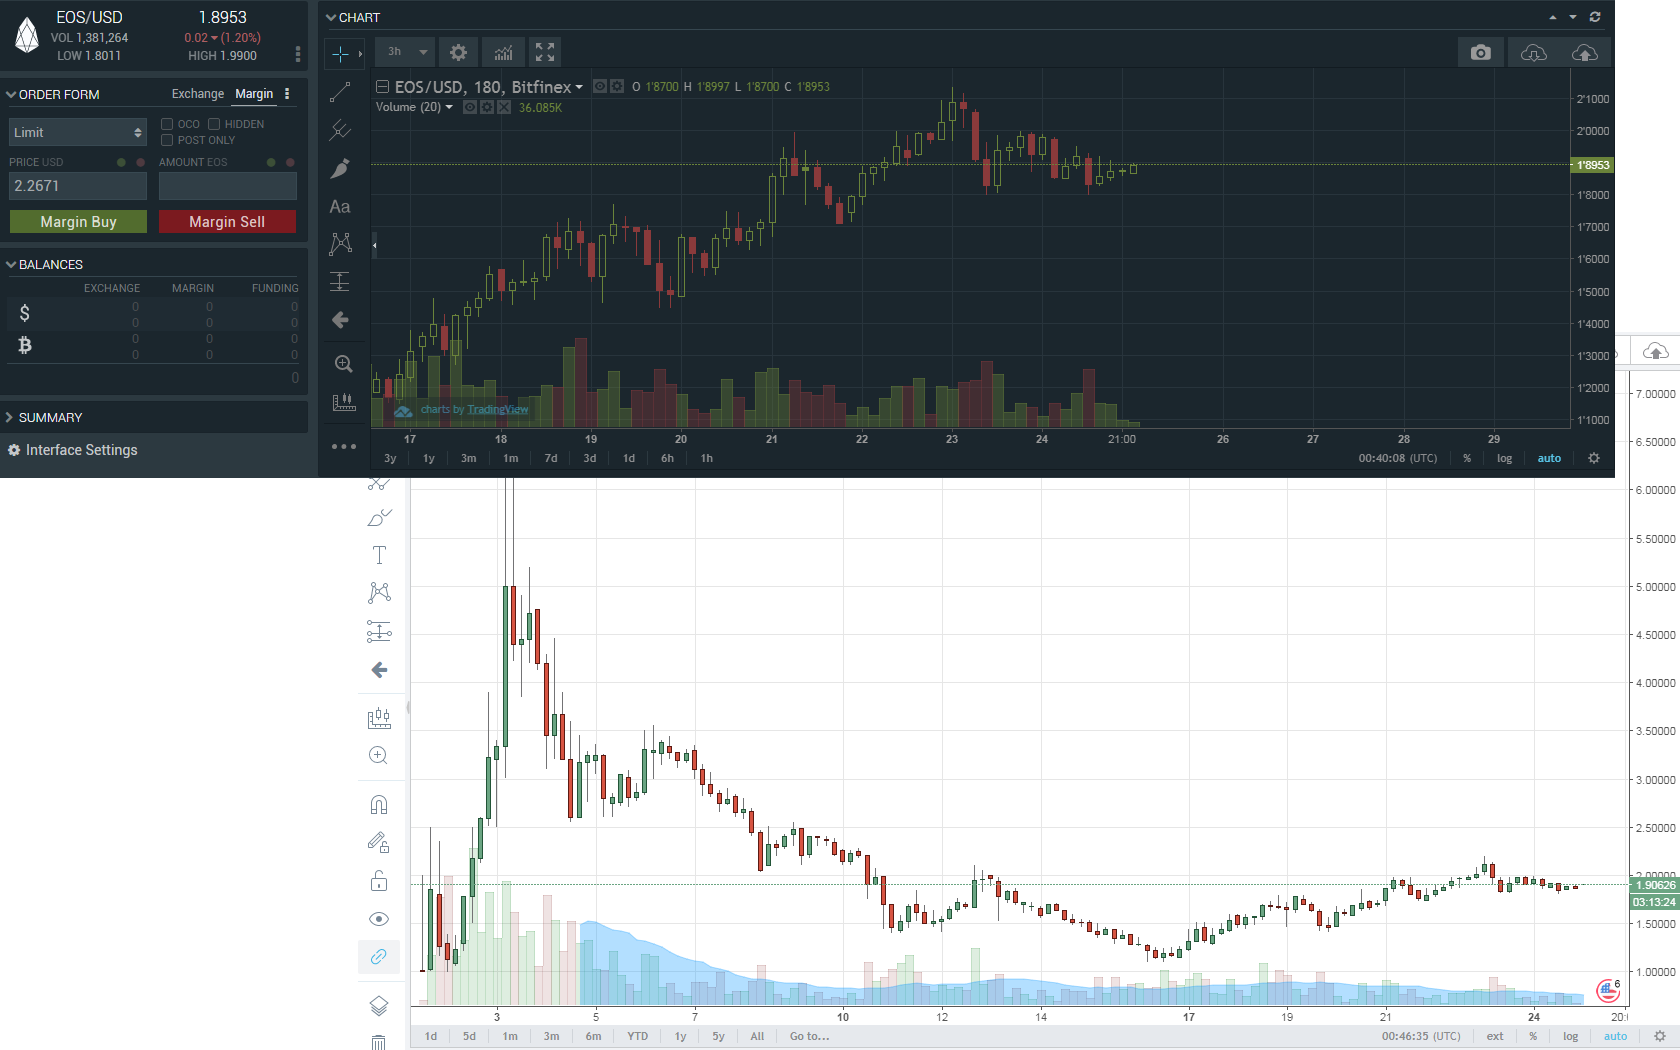
For prices week ahead I will be using 4H graph with indicators and tools that tradingview is offering. I can't use daily graph with indicators as indicators predicts future from the past and there are not enough data for that yet.
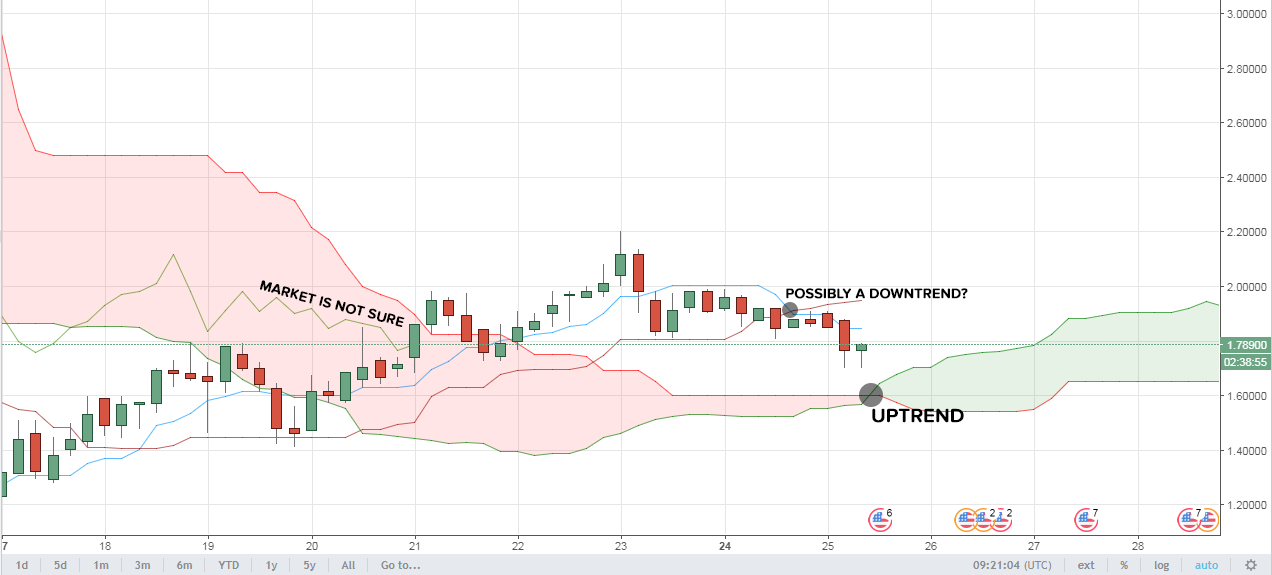
4H
Market is trading above the ichimoku cloud and the cloud twist happened few days ago. Chikou span is however not above the cloud yet and that indicates that the uptrend is still not strong enough and the trend can change very quickly. Chikou span in the cloud indicates indecision on the markets.
Kijun sen is above tenkan sen which indicates downtrend. This can very quickly change back to up-trend though as indicators can only predict and many times the market is doing whatever it wants as I have seen many times. :)
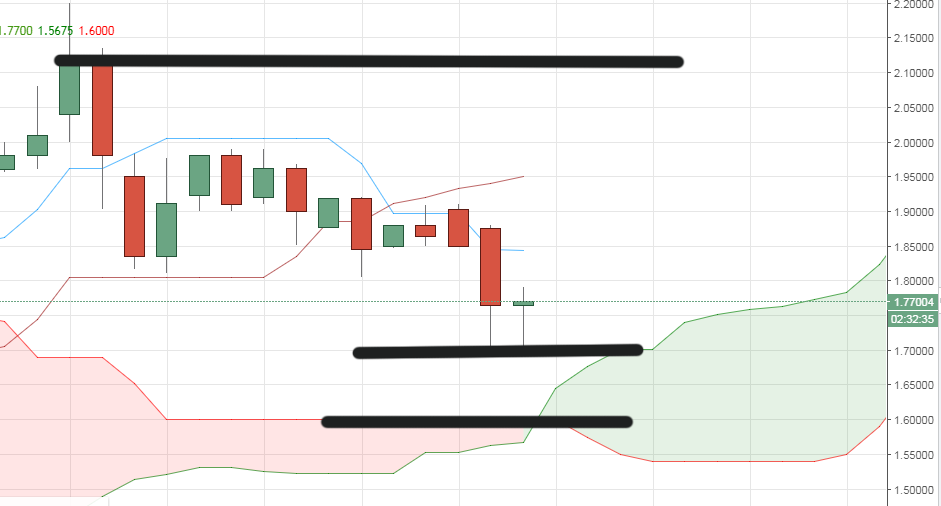
We can also see some supports and resistance on the 4H graph. For now it looks like the support is still there and holding strong. Still 2 hours for the next candle so everything can happen. It can even be a doji with a longer bottom wick.
This is the market that I would not trade as the best trading opporunity is far gone - ichimoku cloud twist. However it's a competition and even though the trend is still undecided and on the 1H graph we can see a big downtrend that is starting, you have to think of the price of EOS for the next week.
A) If the chikou span will take off above the cloud the EOS will be between $2-$2.15 each. I can't think of higher price as EOS is in ongoing ICO.
B) If the downtrend will be stronger I am thinking price between $1.6 to $1.65 next week. There are some supports that can stop the downtrend for a while.
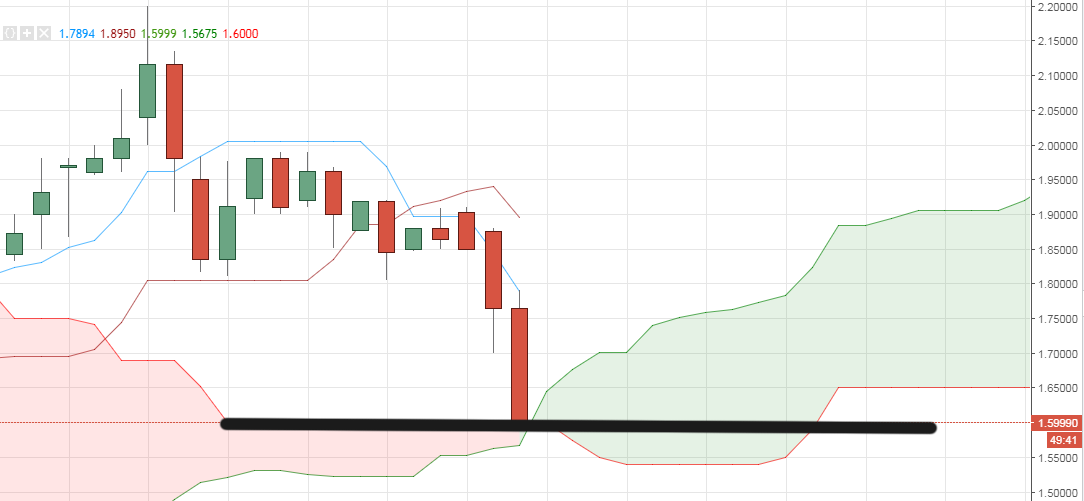
EDIT BEFORE POSTING
Looks like it will not be a doji, but a huge red candle that was formed and is now on the support level I had in my analysis. I am not losing hope of the surge next week though! :)
And what do you think? Make your own post on the EOStalk forums (eostalk.io) and join the contest! :)
Thank you!
My previous post:
@eirik/my-whaletank-promo-art
@eirik/new-whaleshares-token-beyondbit-token-needs-logo