Key Highlights
ETH price is facing selling pressure and already moved below the $330 support against the US Dollar.
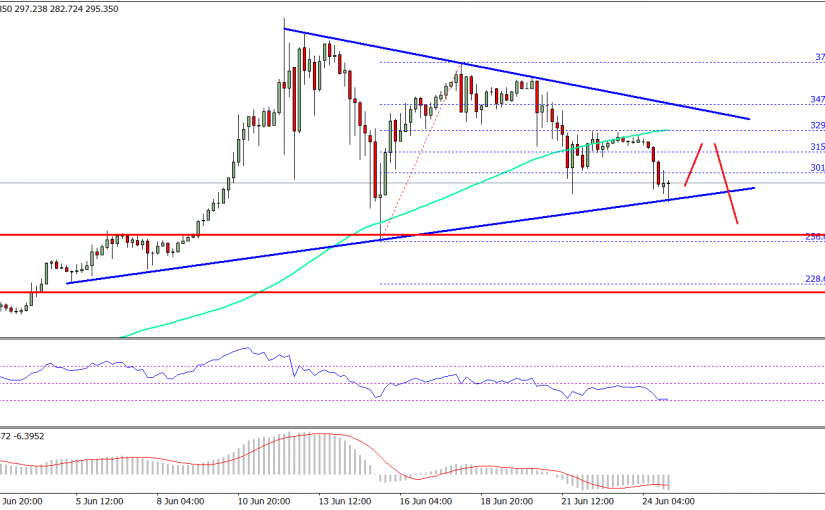
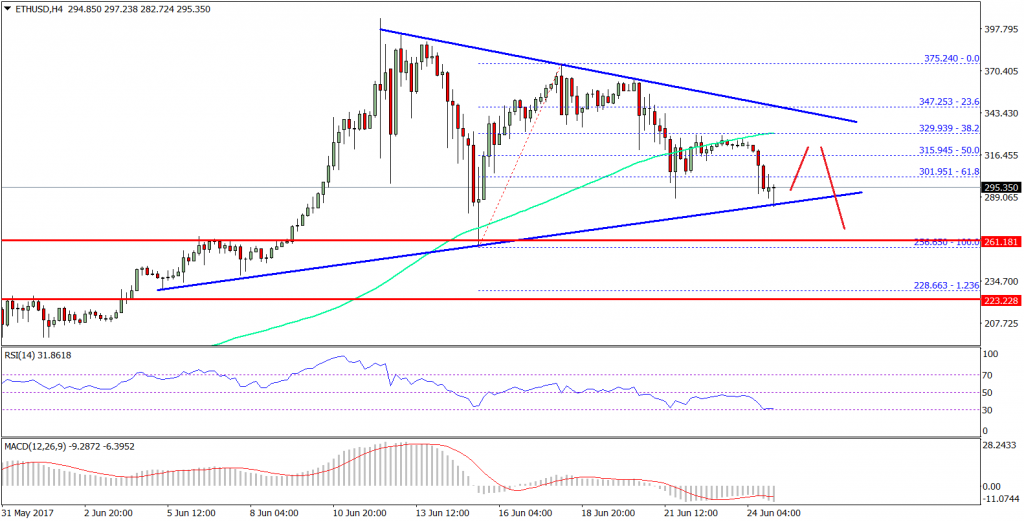
The ETH/USD pair is currently attempting a downside break below a crucial triangle at $285 on the 4-hours chart (data feed via SimpleFX).
A break below it could ignite further losses towards the $240 level in the near term.
Ethereum price is short-term bearish against the US Dollar and Bitcoin, and ETH/USD is testing a major support area at $285 which holds the key.
Ethereum Price Downside Break?
It was a slight negative week for ETH price as it moved below the $350 and $330 support levels against the US Dollar. The price faced a lot of selling pressure and also traded below $328 and the 100 simple moving average (H4). There was a bearish wave pattern which started from $256 and ended near $375. The price is now once again under selling pressure and testing a major support at $285.
Once there is a close below the $285 support, it exposes the price for further declines in the near term. There is a crucial contracting triangle pattern forming with support at $285 on the 4-hours chart of ETH/USD. If buyers fail to protect losses below the same, there is a chance of ETH retesting $256. Moreover, if there is an increase in selling pressure, there can be a test of the $228 level as well. It represents the 1.236 extension of the last wave from the $256 low to $375 high.
On the upside, the $320 and $330 levels are resistances. Furthermore, the 100 SMA (H4) might also act as a hurdle near $328. If there is a correction, the price may struggle near $328-330 and move down once again.
4-hours MACD – The MACD is placed in the bearish zone.
4-hours RSI – The RSI is currently into the oversold area.
Major Support Level – $285.00
Major Resistance Level – $330.00
That not my creation it's newsbtc.com!
