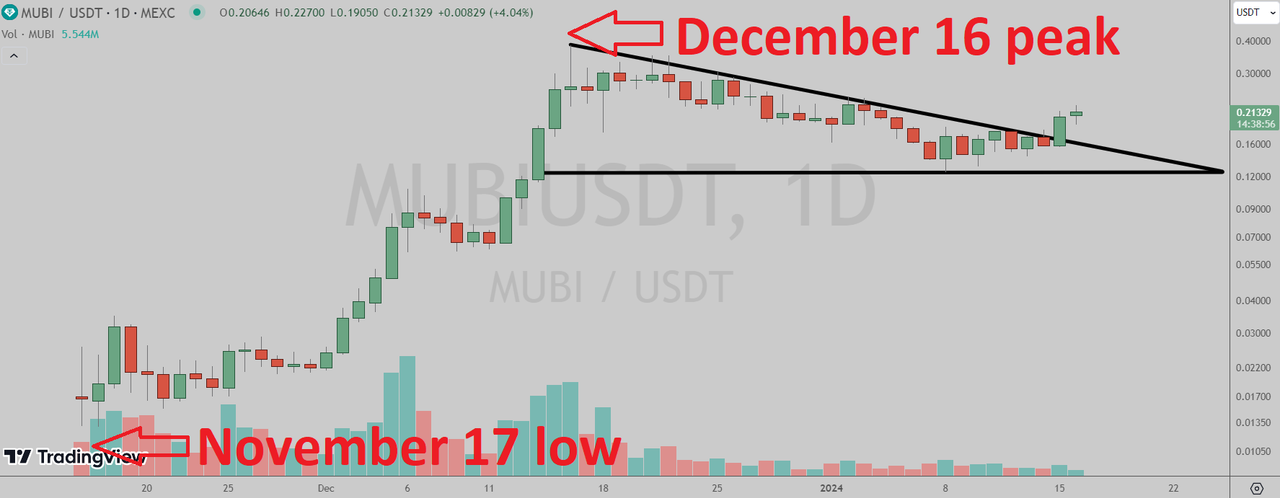
Multibit (MEXC: MUBIUSDT) has broken out of the triangle pattern in the daily chart.

(Chart courtesy of Tradingview.com(log scale))
Elliott Wave Analysis
In Elliott Wave terms, MUBI began a red wave one advance on November 17. The red wave one (blue sub-waves i-ii-iii-iv-v) peaked on December 16 and the red wave two (blue sub-waves a-b-c) correction ended on January 8. If this wave count is correct, MUBI should be heading next towards the December 16 peak in the red wave three.

(Chart courtesy of Tradingview.com(log scale))
Funnymentals
MultiBit is the "first-ever" dual-sided bridge designed for easy cross-network transfers between BRC20 and ERC20 tokens. Smart Money Crypto reviewed the project one week ago.
(Sources: https://multibit.exchange/)
How Will Multibit Trade?
Multibit (MEXC: MUBIUSDT) daily chart by Tradingview.
(Chart courtesy of Tradingview.com(log scale))
Prizes
I will be giving upvotes to the correct answers (posts only).
Rules
This poll will expire in one week. Only one vote per person.
Which one will happen first?
Please select one of the three choices and comment below
MUBI will takeout the December 16 peak
MUBI will drop below the November 17 low
MUBI will stay in a trading range between the November 17 low and the December 16 peak until February 21