)
SUMMARY
On the equity side, I believe we could see a fantastic first 2 or 3 quarters....like near double of DOW and SPX. Yes, yes...I know who the permabears are out there constantly calling for the skies to fall on the markets. It matters none to me as they've been doing that since March of 2009 and have been more wrong than a broken clock!
IF the equity market does near double; well, gold could fall because they are inversely correlated...right? NO! Not to me. I don't believe that such inverse correlation is a reliable indicator because they only are until they are not. I've often discussed the phasic and non-phasic nature of even cryptos. Many now think that if Bitcoin (BTC) rises, then the Altcoins will decline and the inverse. Not so, IMHO. The cycles of the Bitcoin and Altcoins happen to have overlaps (phasic) and segragated (non-Phasic) episodes. There are successful traders who use such cycles e.g. Hurts Cycles; but I have not gained the expertise. My method of analysis takes each and every article on its own merits for Elliott Waves and Chart Patterns. Of course, I scan and observe for market conditions and influences; but my analysis is primarily based on price being the purest and earliest reflection of sentiment and so price only matters.
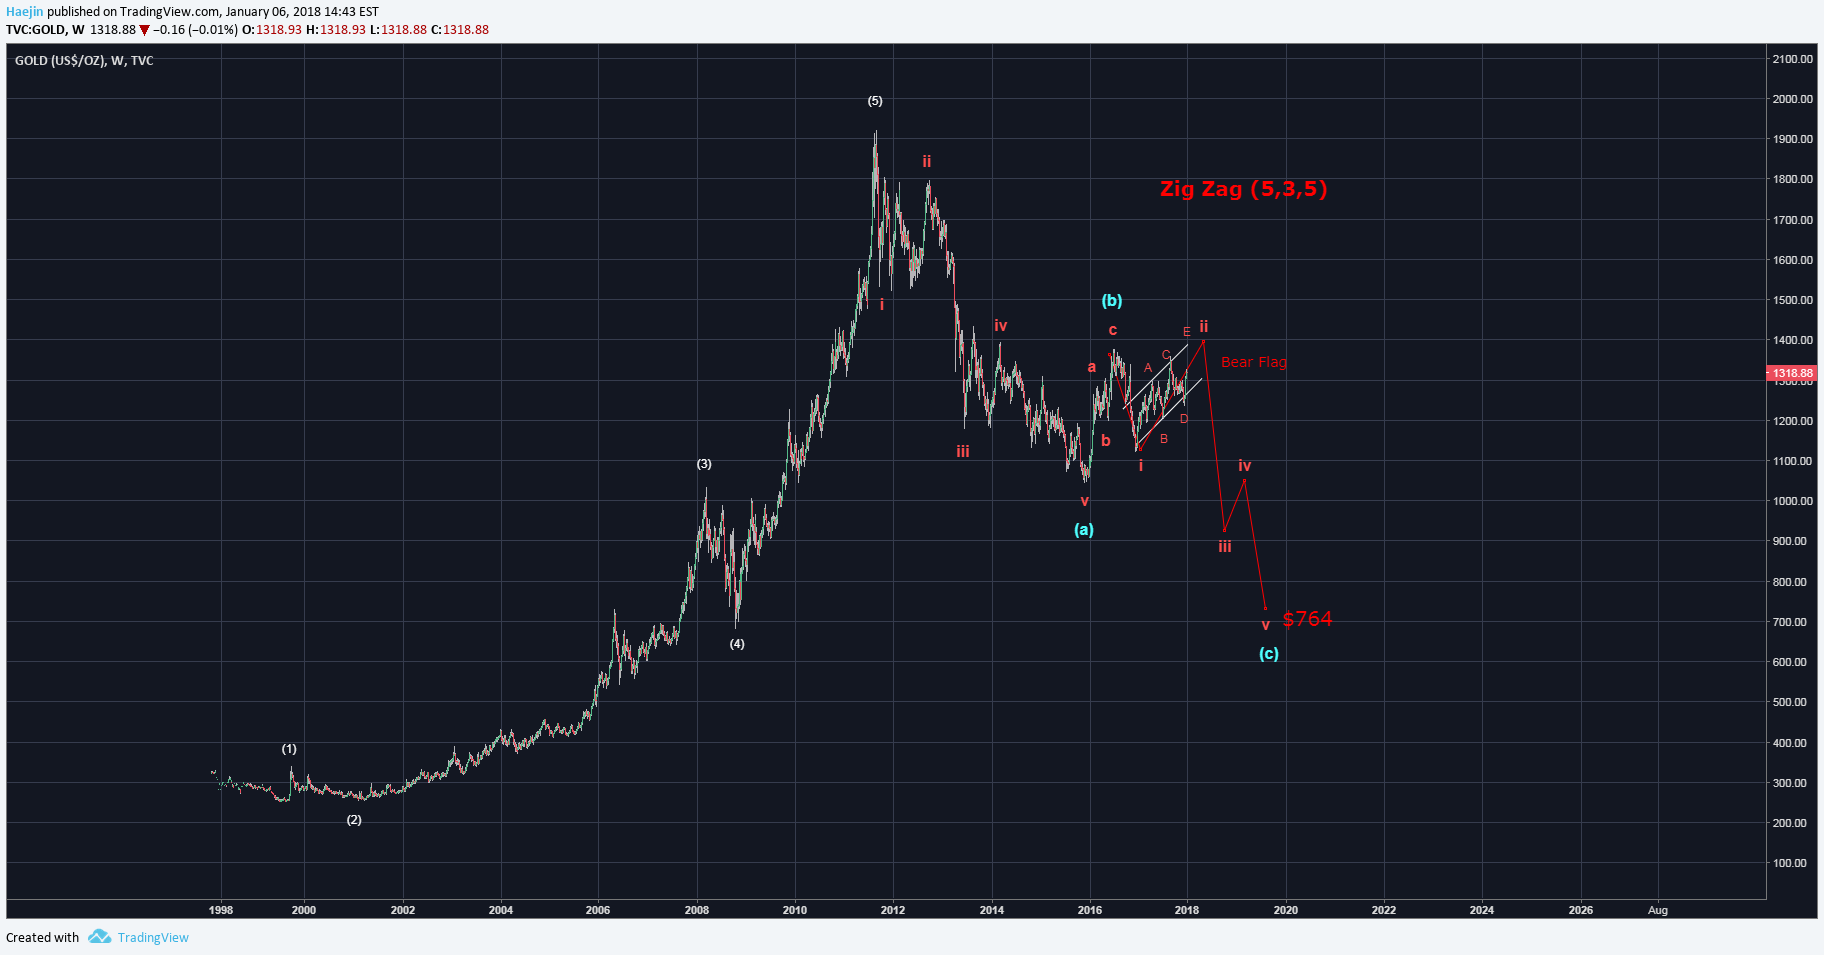
The below chart represents a weekly chart of the precious metal: Gold. Allow me to take you through the chart. From the left, Gold completed a beautiful and vintage impulse wave of five waves. Elliott Waves states that after five waves, there is a requisite a,b,c correction. Sure enough, after reaching a high of $1,921; the correction started back in August of 2011 and has been continuing its mortifying decline of five red waves to complete the blue (a) wave of the correction. The blue (b) wave is always composed of three subwaves and its subwaves have been labeled accordingly. The first red wave 1 of the blue (c) wave completed and it seems the red wave 2 has also completed. This wave 2 of blue (c) wave also seems to be displaying a bear flag pattern; a highly befitting pattern for impending declines to come. That leaves red waves 3,4,5 of blue (c) and their completions could bring a long awaited closure to the Precious Metal bear market. I show red wave 5 of blue (c) ending at around $765 or so. Perhaps, the next time you hear someone call for GOLD targeted for $5,000 and Silver to $600, consider waiting and do your due diligence!
Please consider reviewing these Tutorials on:
Elliott Wave Counting Tutorial #1
Elliott Wave Counting Tutorial #2
Elliott Wave Counting Tutorial #3
Laddering and Buy/Sell Setups.
Laddering Example with EOS
Tutorial on the use of Fibonacci & Elliott Waves
These Technical Analysis Books: Elliott Wave Priniciple & Technical Analysis of Stock Trends are highly recommended
@haejin's Trading Nuggets
Essay: Is Technical Analysis a Quantum Event?
Follow me on Twitter for Real Time Alerts!!
Follow me on StockTwits for UpDates!!
--
--

If this blog post has entertained or helped you to profit, please follow, upvote, resteem and/or consider buying me a beer:
BTS Wallet - haejin1970
BTC Wallet - 1HMFpq4tC7a2acpjD45hCT4WqPNHXcqpof
ETH Wallet - 0x1Ab87962dD59BBfFe33819772C950F0B38554030
LTC Wallet - LecCNCzkt4vjVq2i3bgYiebmr9GbYo6FQf

Legal Disclaimer: This is only my opinion, make of it what you wish. What does this mean? It means it's not advice nor recommendation to either buy or sell anything! It's only meant for use as informative or entertainment purposes.**