I made some progress with my RAC estimation experiment. At the moment I'm doing all work manually in a spreadsheet. As mentioned in a previous post I keep an eye on the hosts details site an write down the RAC from time to time. The host is running 24/7. Please note that at this time this is a very limited experiment. Some results will scale but I'm not sure yet to what extend.
What's new? I managed to prove that my understanding of the RAC calculation is sufficient to make an exact calculation of the RAC which corresponds with what the server reports.
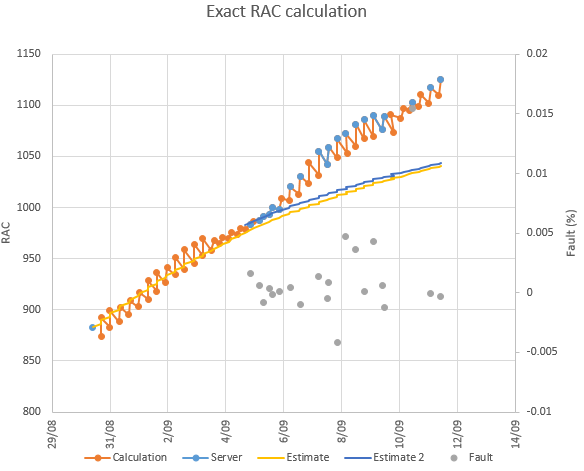
In the chart the light blue dots is the RAC as calculated by the project server. RAC changes when a WU is completed and verified and is not stored, so cannot be viewed historically. So I don't have a blue dot everywhere, just where I checked. The orange series is my calculations based on the tasks info available from the server. The grey dots represent the error of my calculation compared to the servers calculation.
As you can see the fault is very low. Most probably this is due to the precision of the figures shown on the site. The site only shows 2 significant digits and a slight error there might be enough. I did not check in further detail as these numbers seem to confirm my understanding of the calculation.
As you can see as well, my estimation is off. I have an idea why and how to correct but haven't got the time yet to try it out.
More to come...