Let's hit the charts
Image edited by me in Powerpoint
What is A/D Indicatior?
Accumulation means that people get an asset and hold it, made by the law of supply and demand the price go up.
Distribution means that people get rid of an asset (distribute it), causing the price to go down.
Precisely the (A/D) Indicator measures this factor and tells us where we are in the market cycle (Accumulation or Distribution) and gives us certain signals that will help us make good decisions. Graphically it is as simple as it gets: it is a line located below the price of the asset and moves up and down on a scale located on a panel on the right side of the screen.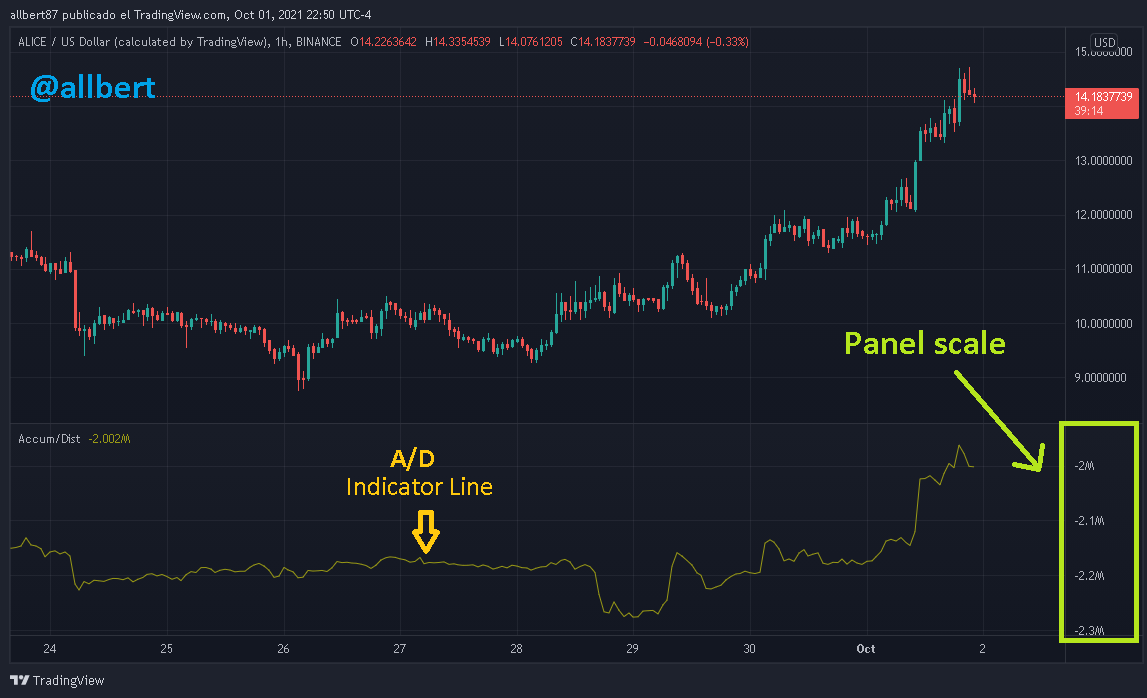
Image taken from Tradingview Source
The scale located in the right panel is completely different from the price scale, and it is so because of the formula used to calculate the indicator... (But that's up to you to figure out).
How it works A/D Indicatior
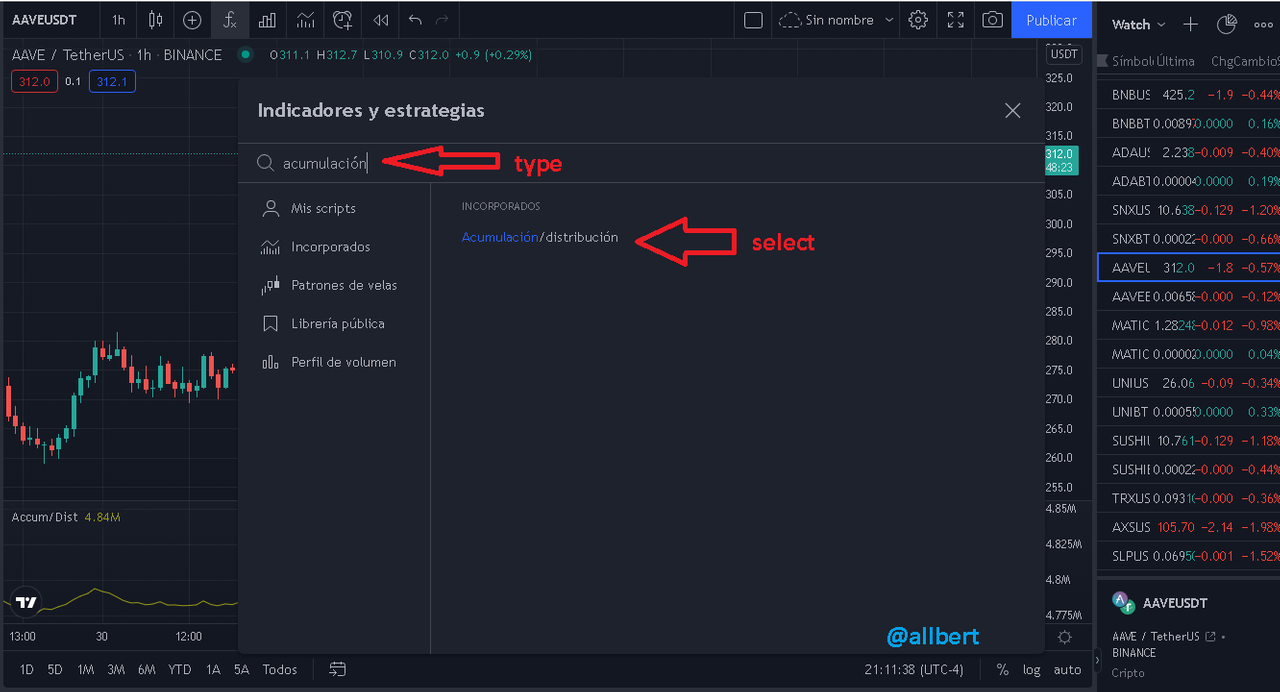
Image taken from Tradingview Source
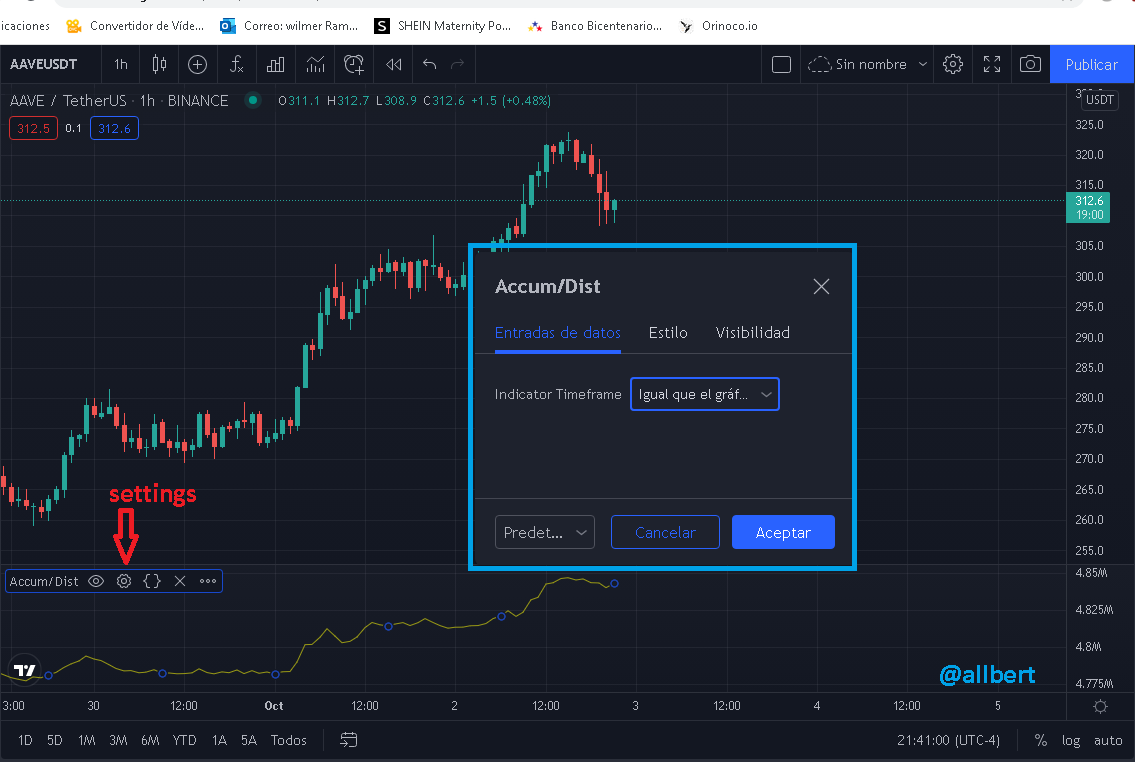
Image taken from Tradingview Source
Pros & Cons of A/D Indicatior
PROS
- In general, (not specifically) This indicator is based on the two most important aspects of the market in my view: price action and volume.
- Simple to use and to interpret.
- It tells us the flow of money, i.e. whether it is entering the asset or leaving it. Always go in the direction the money is going!
- It detects trends and trend changes.
CONS
- Doesn't always give accurate signals there are times where it doesn't give signals at all and just keeps to the general trend.
- It is not very sensitive, so it may not react to small price movements.
- It is not recommended for all types of trading.
- Do you remember Gaps of the class number 1? Well, this indicator does not detect them, since its formula is highly based on the closing prices of the candlesticks. Again this detracts from its reliability.
How to use A/D Indicator to detect trends
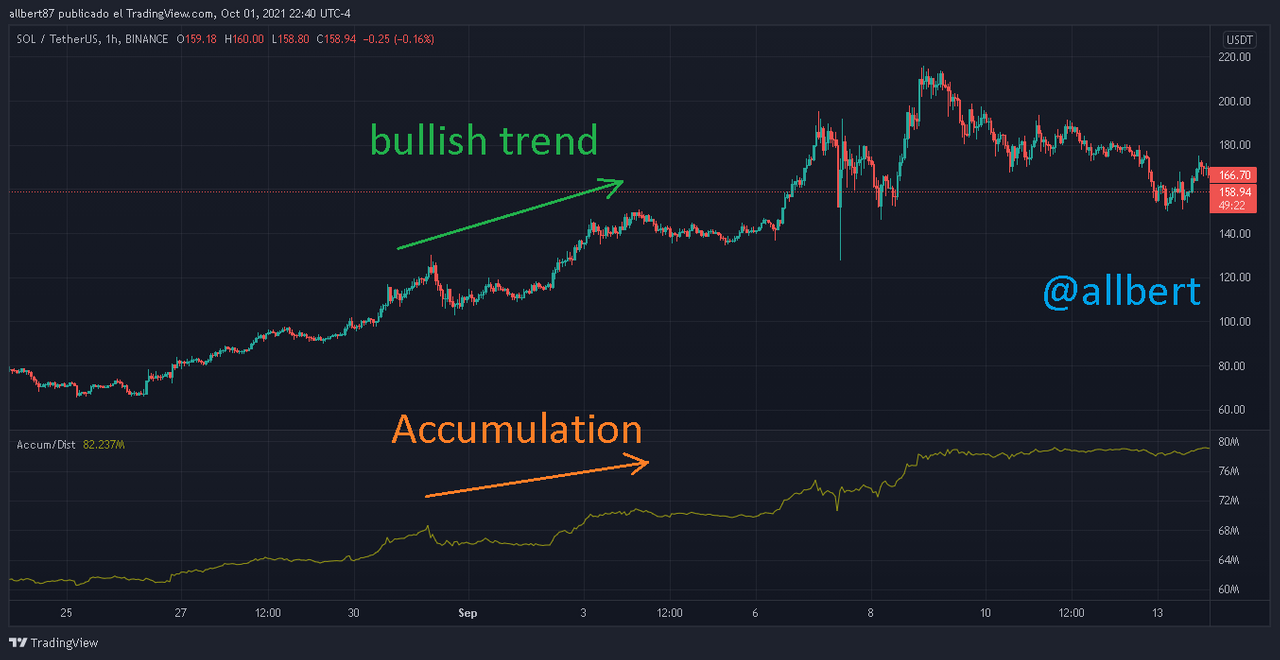
Image taken from Tradingview Source
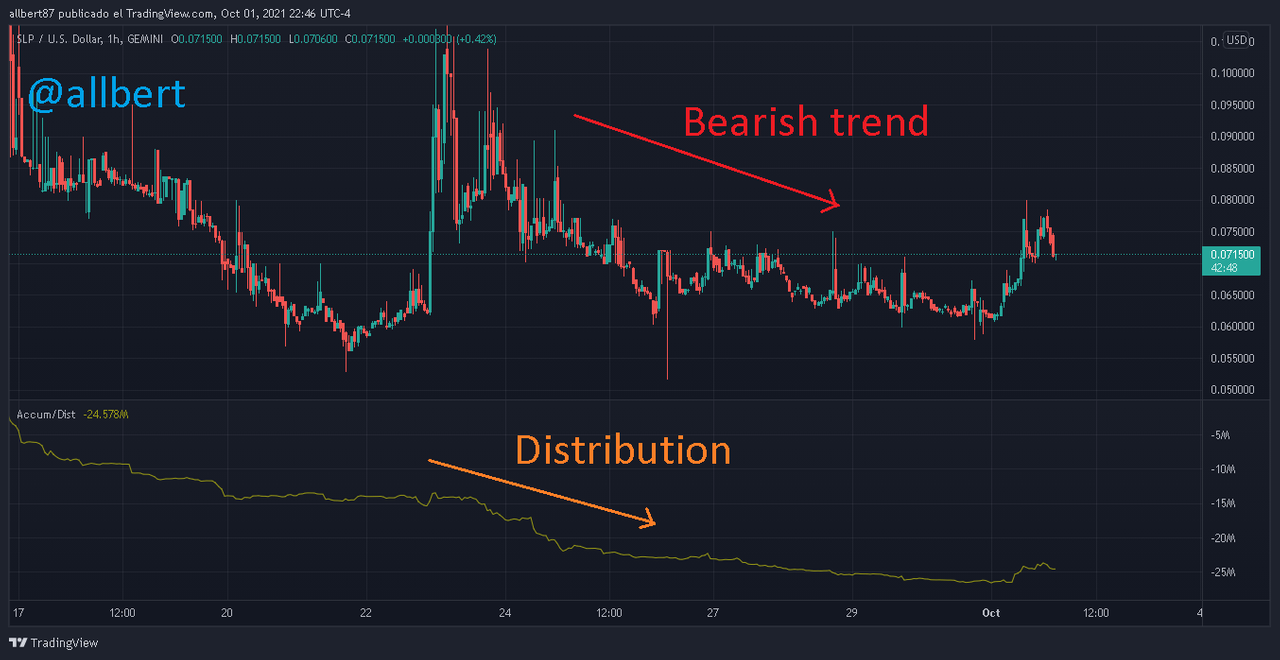
Image taken from Tradingview Source
I know what you're thinking, maybe you're saying: many indicators do this... what makes it special?. Well, the main function of this indicator is through not trend confirmation but divergences.
How to use A/D divergences in trading
1- Find a divergence where the price is falling and the A/D Indicator is rising. This phenomenon is a clear indication that the bearish phase is about to end because money is flowing into the asset.
2- The downtrend in price will describe several lower highs. Draw a trend line that joins them all together.
3- Wait for the price to break the trend line. When this happens wait for the price to move away from the trend line (move up). At the close of the candle, you can place your long entry.
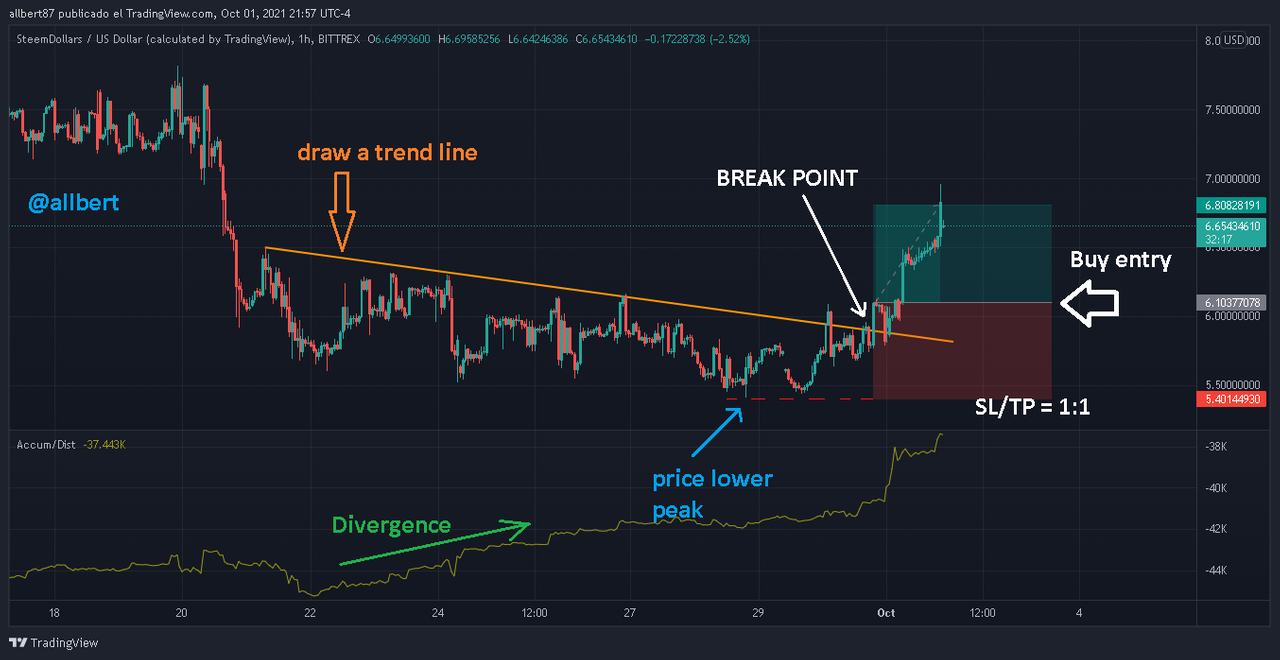
Image taken from Tradingview Source
4- To place the Stop Loss you can base it on the lowest point or peak of the price during the downtrend and place it slightly below.
5- For the take profit, you can base it on the 1:1, 1:2, or 1:3 Risk/Reward Ratio.
On the other hand, if you consider yourself a slightly more cautious trader you can opt to use the BRB strategy, wait for the price to retest the trend line, and place your entry further ahead. For example.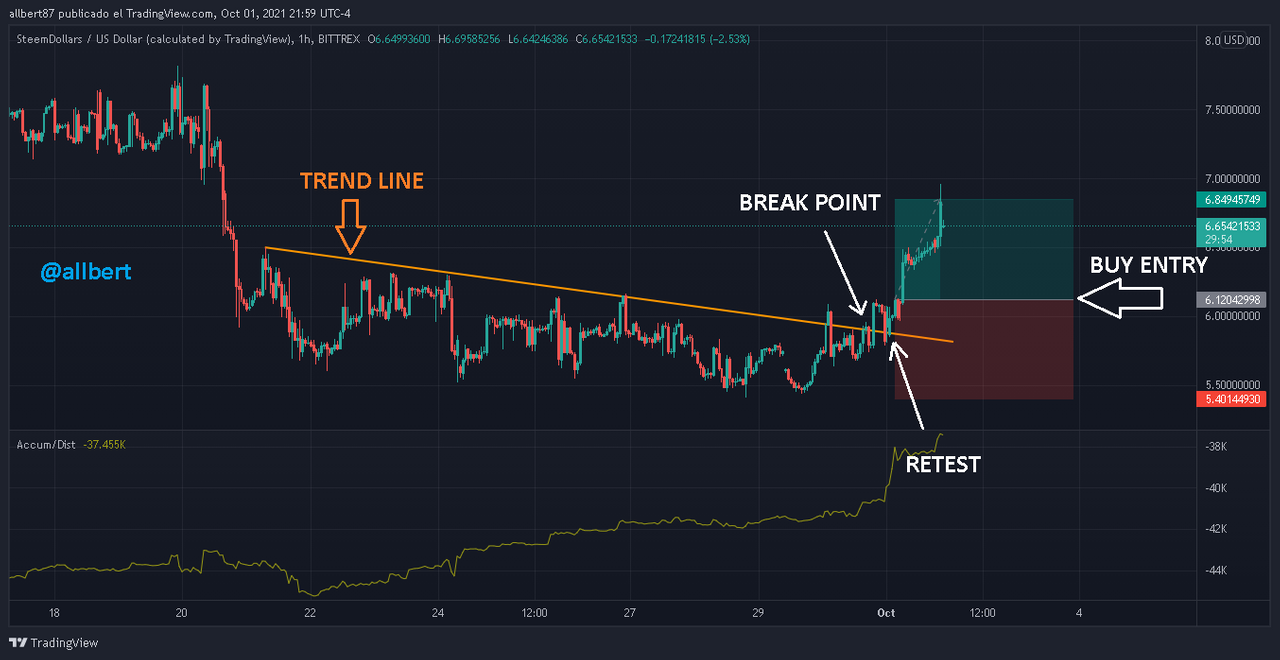
Image taken from Tradingview Source
1- Find a divergence where the price is rising and the A/D Indicator is falling. This phenomenon is a clear indication that the bullish phase is about to end because money is flowing out of the asset.
2- The uptrend in price will describe several higher lows. It draws a trend line that joins them all together.
3- Wait for the price to break the trend line. When this happens wait for the price to move away from the trend line (go down). At the close of the candle, you can place your short entry.
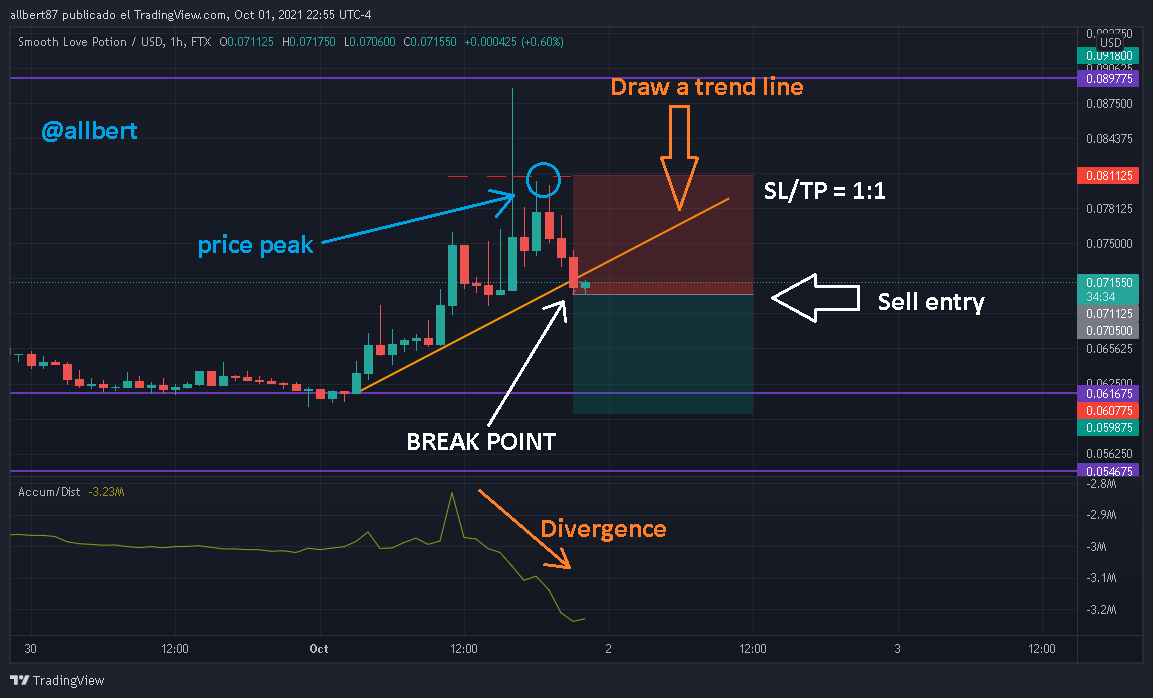
Image taken from Tradingview Source
4- To place the Stop Loss you can base it on the highest (recent) price point or peak during the uptrend and place it slightly above. In my case, I decided to overlook the extremely high wick that occurred 5 periods back because I consider that it is not congruent to the normal behavior of the asset.
5- For taking profit again you can rely on the 1:1, 1:2, or 1:3 Risk/Reward Ratio.
Finally, let's see how we are doing so far: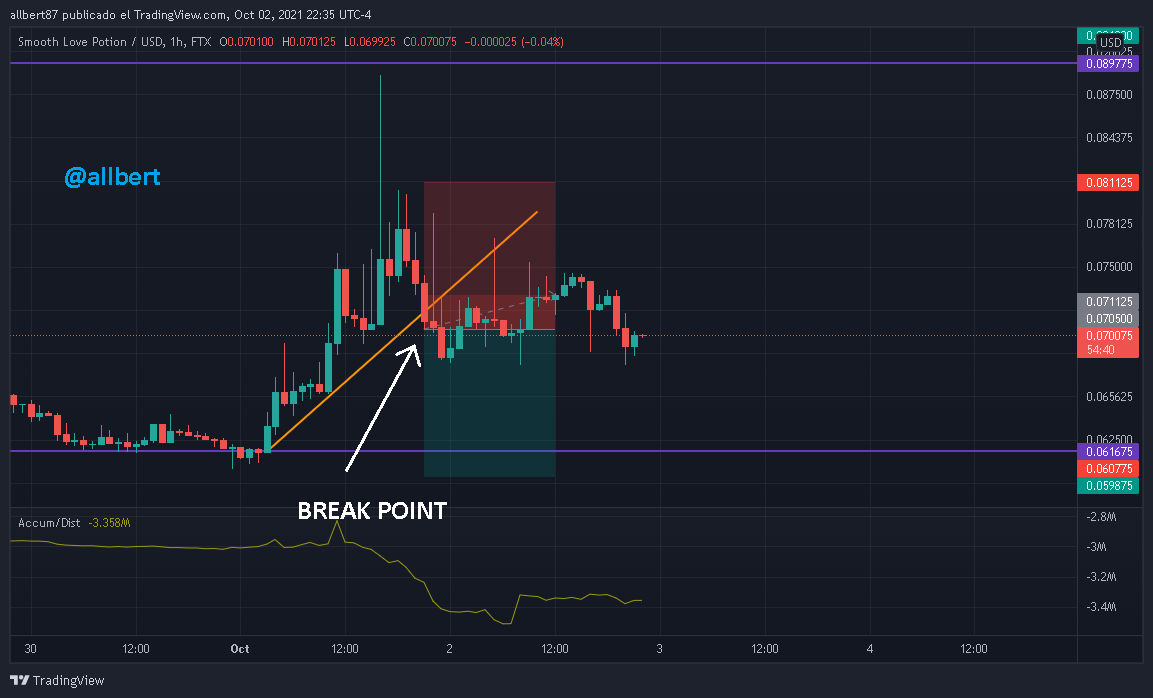
Image taken from Tradingview Source

CONCLUSION
I would like to focus on this conclusion not on talking about the Indicator, which I think is very simple and its function is clear. Rather I wish to focus on the function of the teachers in the Academy.
We are just facilitators, who indicate the important knowledge to discovery in the middle of a Sea of information and where to look for it, the rest is up to you all my friends. As I always say, the knowledge that sticks best in our brain is the one we discover by ourselves. On the other hand, I wish you to know that from our side there are only good intentions as long as the rules of the game are respected. My wish is that you have the financial freedom that trading can offer you... and it is through all these simple tools that you can reach it. On the other hand, do not forget that this method is not infallible, so I recommend you to have good risk management and do not invest more than you are willing to lose.Finally, remember again the use of the new title format that is being used since week 2, which for our case is:
** Trading with Accumulation / Distribution (A/D) Indicator - Crypto Academy / S4W5 - Homework Post for @allbert.**
Homework Task (Season 4/Week-5)
1- Explain in your own words what the A/D Indicator is and how and why it relates to volume. (Screenshots needed).
2- Through some platforms, show the process of how to place the A/D Indicator (Screenshots needed).3- Explain through an example the formula of the A/D Indicator. (Originality will be taken into account).
4- How is it possible to detect and confirm a trend through the A/D indicator? (Screenshots needed)
5- Through a DEMO account, perform one trading operation (BUY or SELL) using the A/D Indicator only. (Screenshots needed).
6- What other indicator can be used in conjunction with the A/D Indicator. Justify, explain and test. (Screenshots needed).
Guidelines
- Make sure you post in the Steemit Crypto Academy community.
- Be Original!!! Refrain from copy any else posts and ideas. Be creative. The content is certainly the same, but the way of presenting it is unique.
- Your article should be at least 400 words.
- Refrain from spam/plagiarism. Plagiarism of any kind won't be tolerated.
- This task requires screenshot(s) of your own experience, add a watermark on it with your username. Also, use images from copyright-free sources and showcase the source, if any.
- This homework task will run from 00:00 October 04th to 23:59 October 09th, Time UTC. (7:59 pm hora Venezuela)
- Avoid editing the post after the deadline. Otherwise, your post will not be accepted.
- Users having a reputation of 60 or above, and having a minimum SP of 400 (excluding any delegated-in SP) are eligible to partake in this Task. (Must not be powering it down)
- Add tag #allbert-s4week5 #cryptoacademy among the first five tags in this order. You can also use other relevant tags like your country tag. Also, tag me as @allbert in any part of your post.
- Please use the tags correctly, do not write them down but rather copy them directly from this publication. If you use the tags incorrectly or make a typographical error we will not be able to locate your assignment.
- Please don’t leave your homework link on the comment section unless your post hasn’t been graded within 48 hours.
- If you have any doubts about Homework Task, feel free to join the comment section