
Introduction

Just like any field specialist, technical analysts in the crypto business require a couple of tools they use in their trade. There are a lot of technical indicators that have been developed over the years with variations too. Amidst so much variations, it is important to know what indicator to use and when.
Professor @fredquantum has introduced an indicator that might be new to a number of us. Following every instruction given, I will now complete the assignment given.

1. What is Aroon Indicator in your own words? What are Aroon-Up and Aroon-Down? (Show them on Chart).

Developed in 1995 by Tushar Chande, the Aroon indicator is a technical indicator that is not very popular to crypto newbies. This indicator is rather special because it measures the direction of a market and the strength in that direction. In clear words, the Aroon indicator is used to determine a trend, identify a trend reversal and determine the strength of the identified trend within a given period of time.
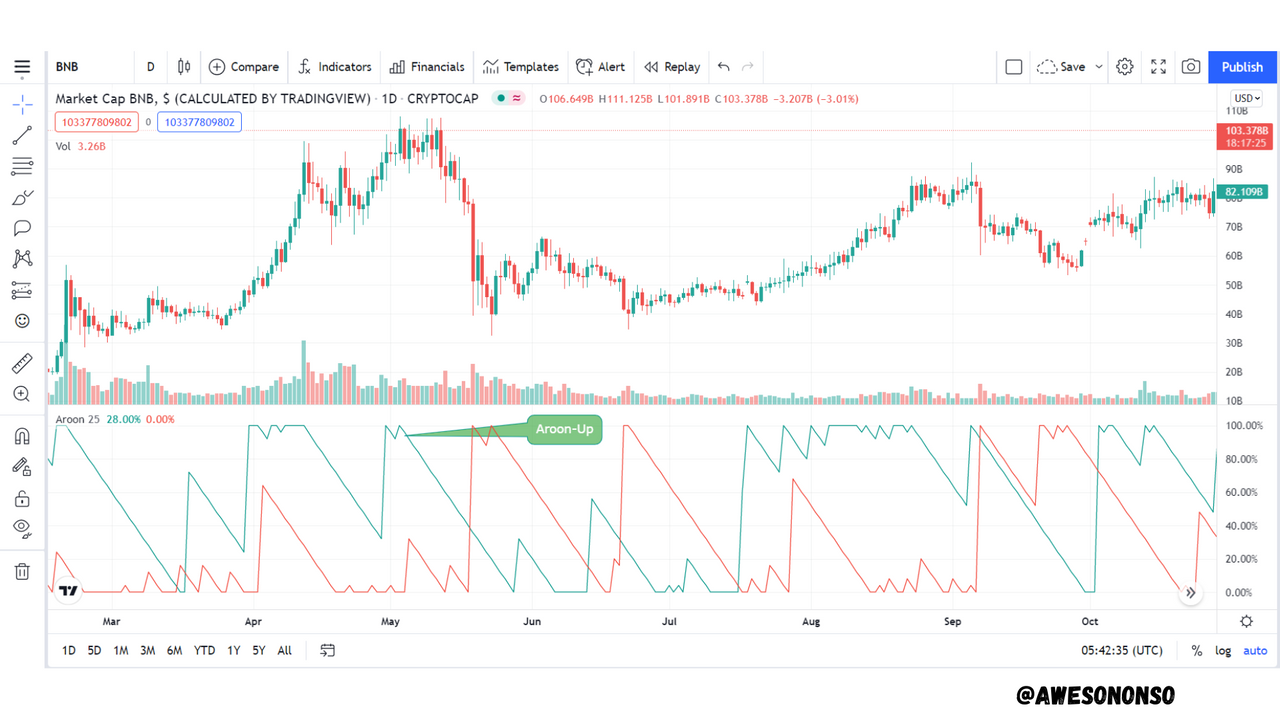
The Aroon indicator is made up of two lines that work within a scale of 0 to 100. The first line is the Aroon-Up while the other is the Aroon-down line.
The Aroon-Up, as the name implies, is used to measure the strength of an uptrend. That is, it is used to measure a bullish movement.
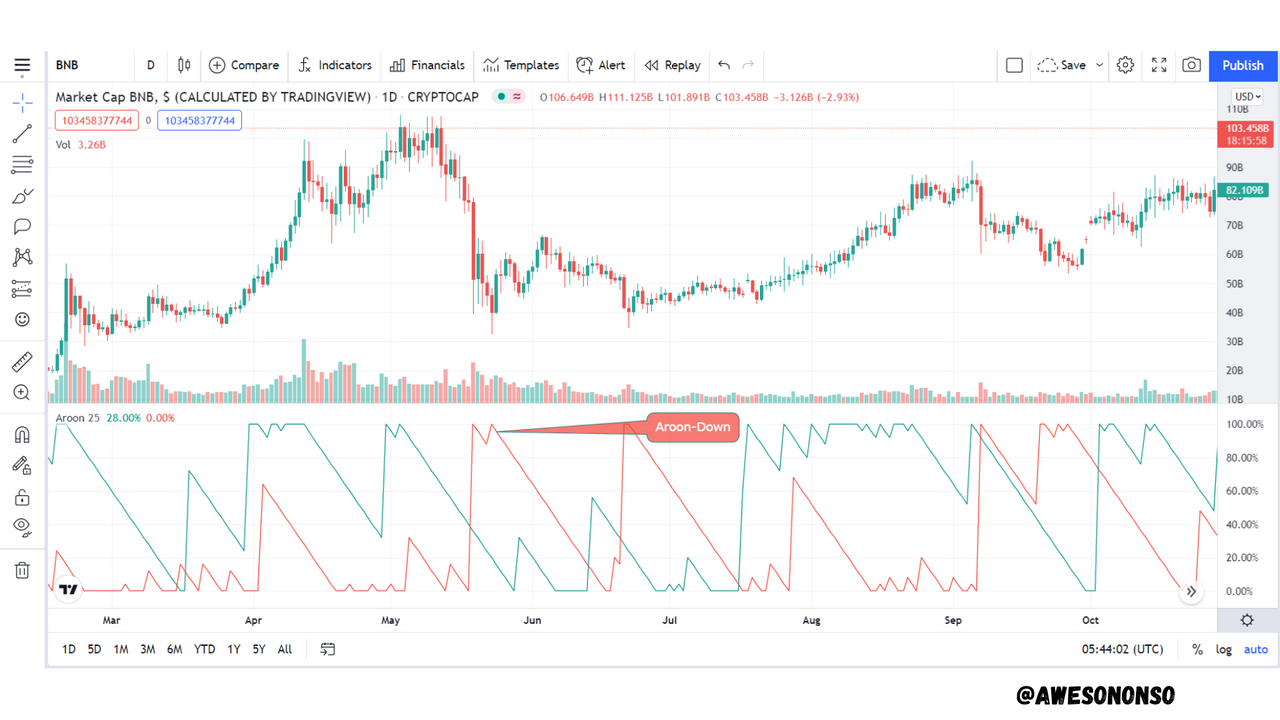
Likewise, the Aroon-Down is used to measure the strength of a downtrend. That is, t is used to measure a bearish movement.
How these lines work.
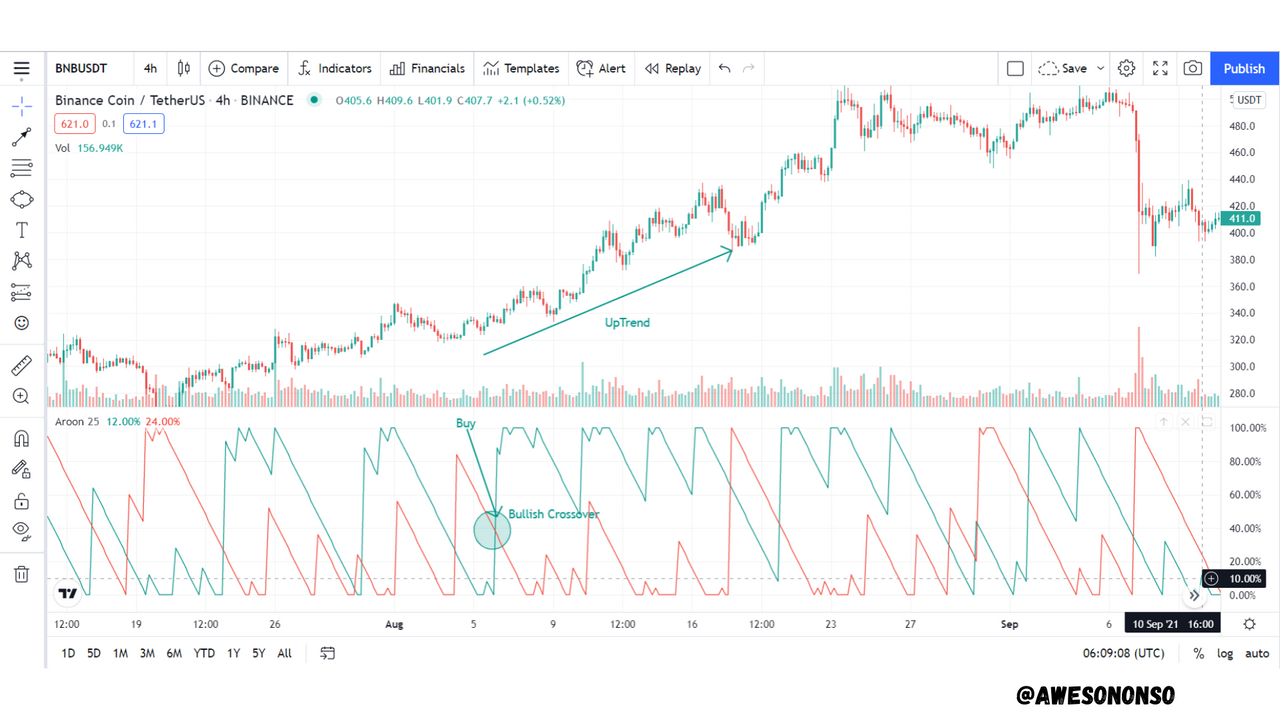
The position of the lines over or under each other indicates the direction of the trend. When the Aroon-Up line is above the Aroon-Down line, it typically means that the market is in an uptrend. Also, when the Aroon-Down is above the Aroon-Up, it indicates a downtrend.
When a trend has been identified, the position of the line on the scale indicates the strength of the trend. Typically, a bullish market is characterized by higher highs while a bearish market is characterized by lower lows. By default, the Aroon indicator is set to a period of 14. When the Aroon-Up line is at 100 and regularly occurs there, it means that highs are formed more quickly within the 14 periods. At 50, it means that the highs are formed within 7 periods and below 50, it means the highs occur in more than 7 periods showing a weak trend. The same is the case foe the Aroon-Down.
Crossovers indicate possible trend reversals. When the Aroon-Up crosses the Aroon-Down downward it means that there would be a possible bearish reversal.
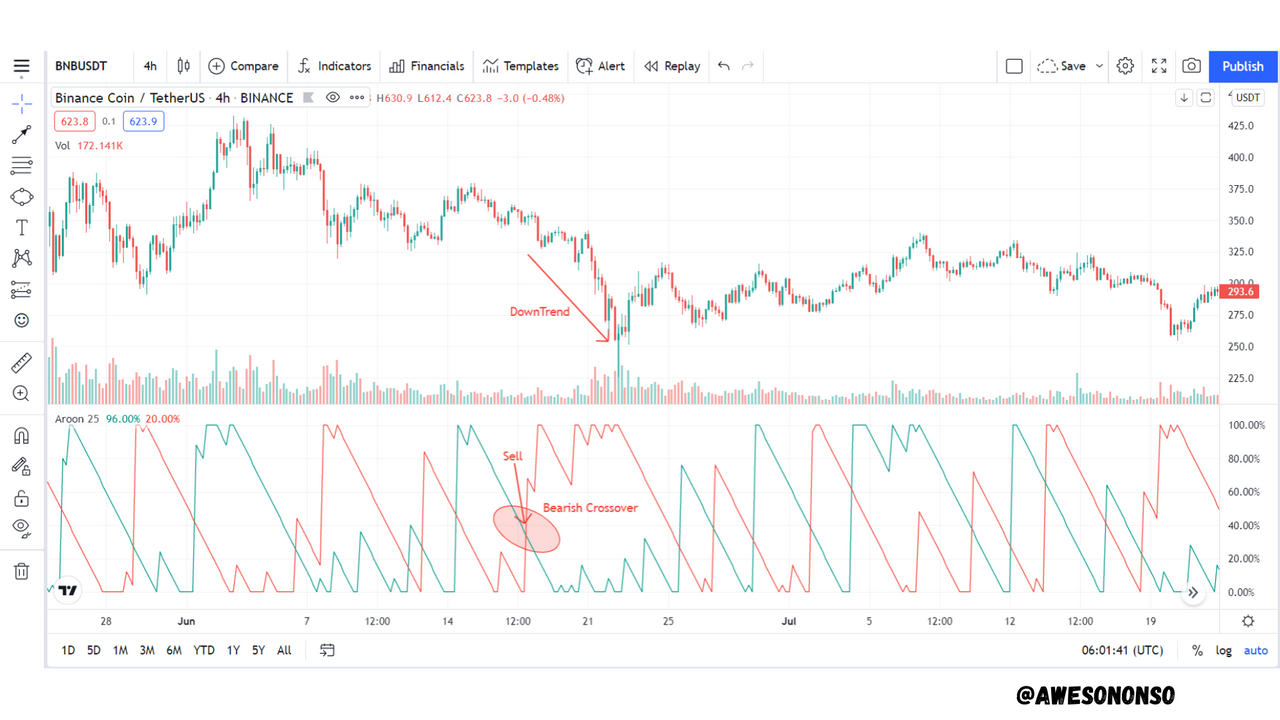
Likewise, when the Aroon-Down crosses the Aroon-Up downward it means a possible bullish reversal.

2. How is Aroon-Up/Aroon-Down calculated? (Give an illustrative example).

For calculating the Aroon-Up and Aroon-Down, I propose the formula;
where N is the period set.
Even though the default period is set at 14, the most commonly used is 25 which is what I will work with.
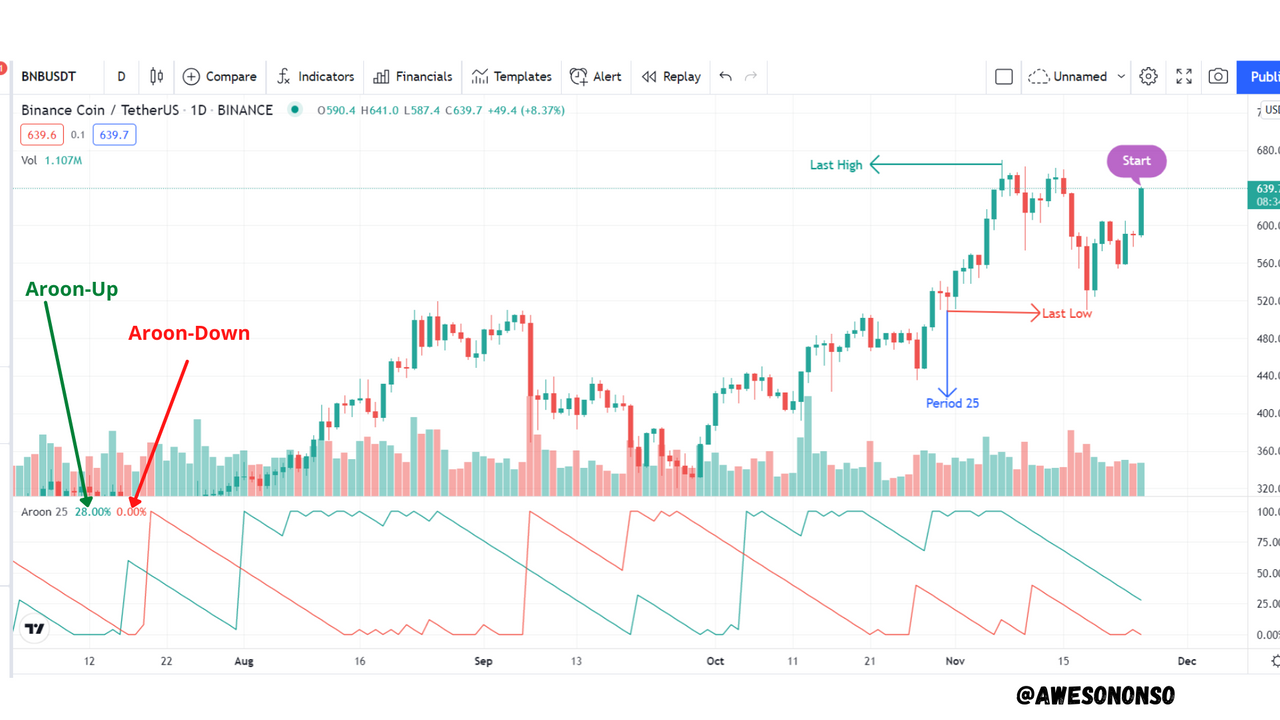
First, we have to count 25 candles before the most recent candle. From the image, I labelled the first candle as "Period 25".
To Calculate the Aroon-Up line:
Formula: Aroon-Up = [(25 - Periods since 25 period high)/25] x 100
I marked the highest candle as "Last High". After counting, there are 18 candles after that high. Substituting, we have;
Aroon-Up = [(25-18)/25] x 100
= (7/25) x 100
= 0.28 x 100
= 28.00 (as indicated in the image above)
To Calculate the Aroon-Down line:
Formula: Aroon-Down = [(25 - Periods since the 25 period low)/25] x 100
The first candle is also the lowest candle which I also marked as "Last Low". After counting, there are 25 candles after that low. Substituting, we have;
Aroon-Down = [(25-25)/25] x 100
= (0/25) x 100
= 0 x 100
= 0.00 (as indicated in the image above)

3. Show the Steps involved in the Setting Up Aroon indicator on the chart and show different settings. (Screenshots required).

To set up the Aroon Indicator;
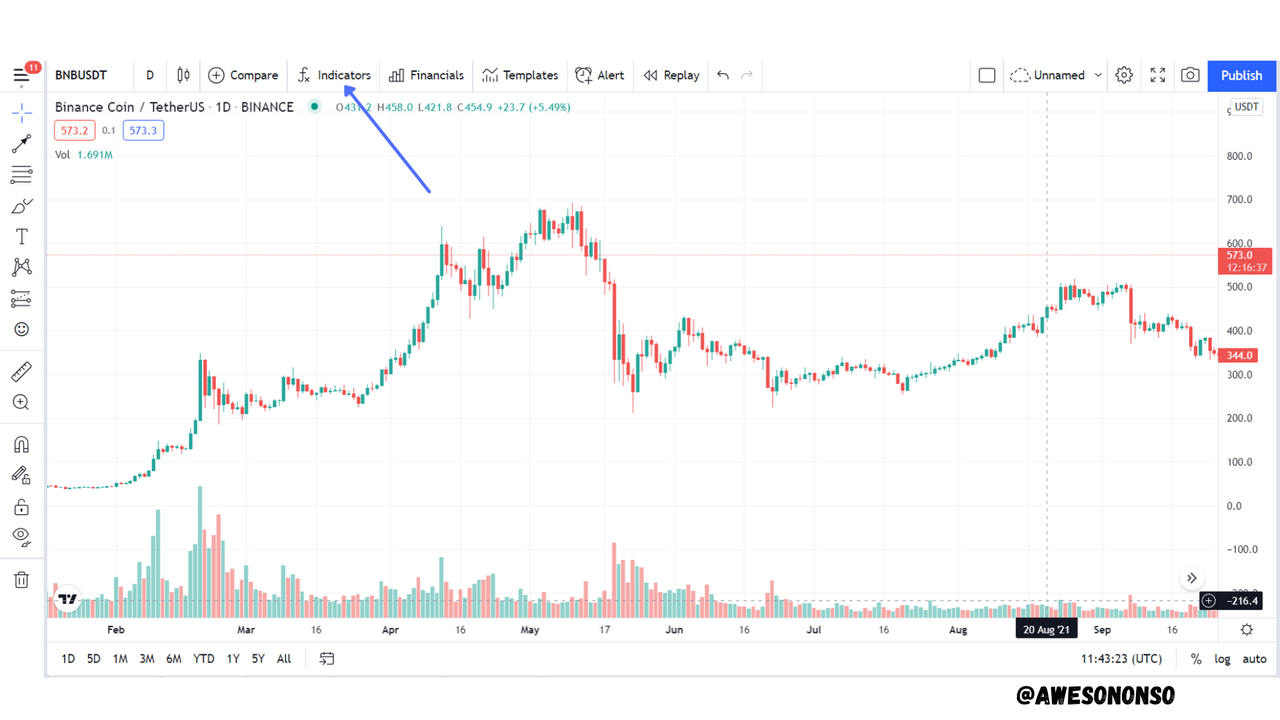
Step 1:Load a desired chart on Trading View and select "fx indicators".
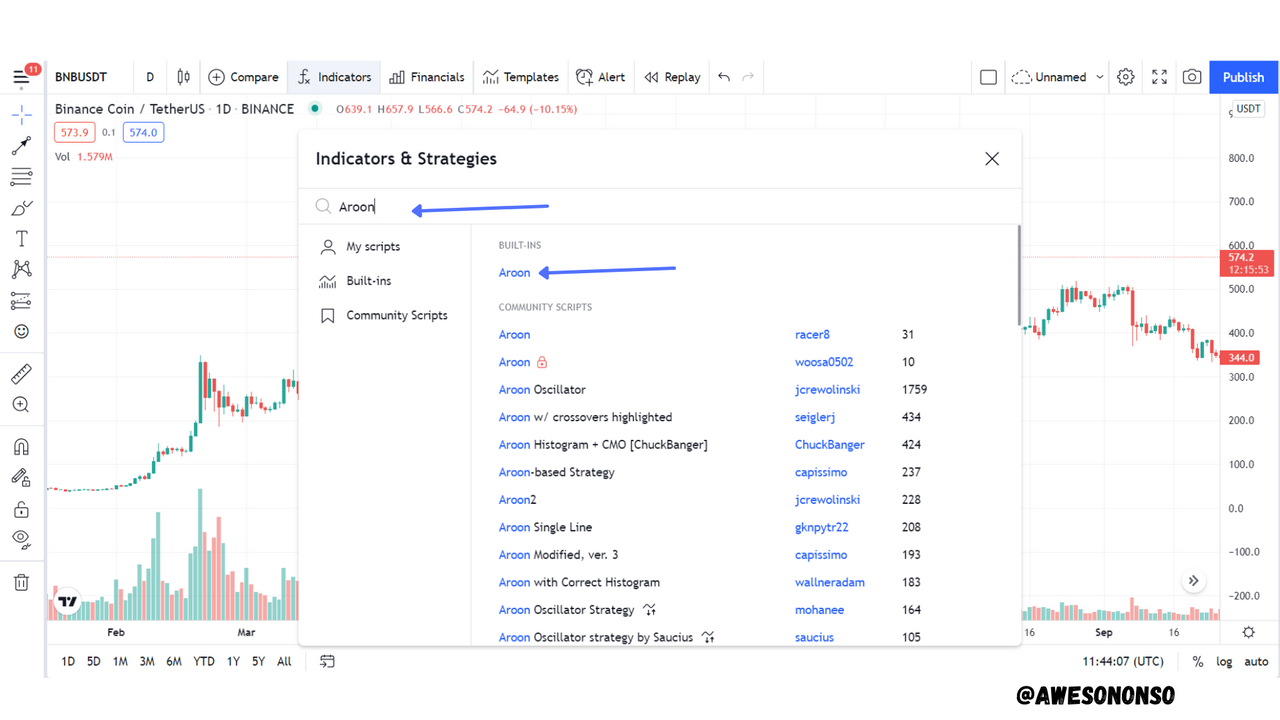
Step 2: Search "Aroon" and select the indicator.
Step 3: After the indicator comes up, click on the corresponding settings button to load the setup.
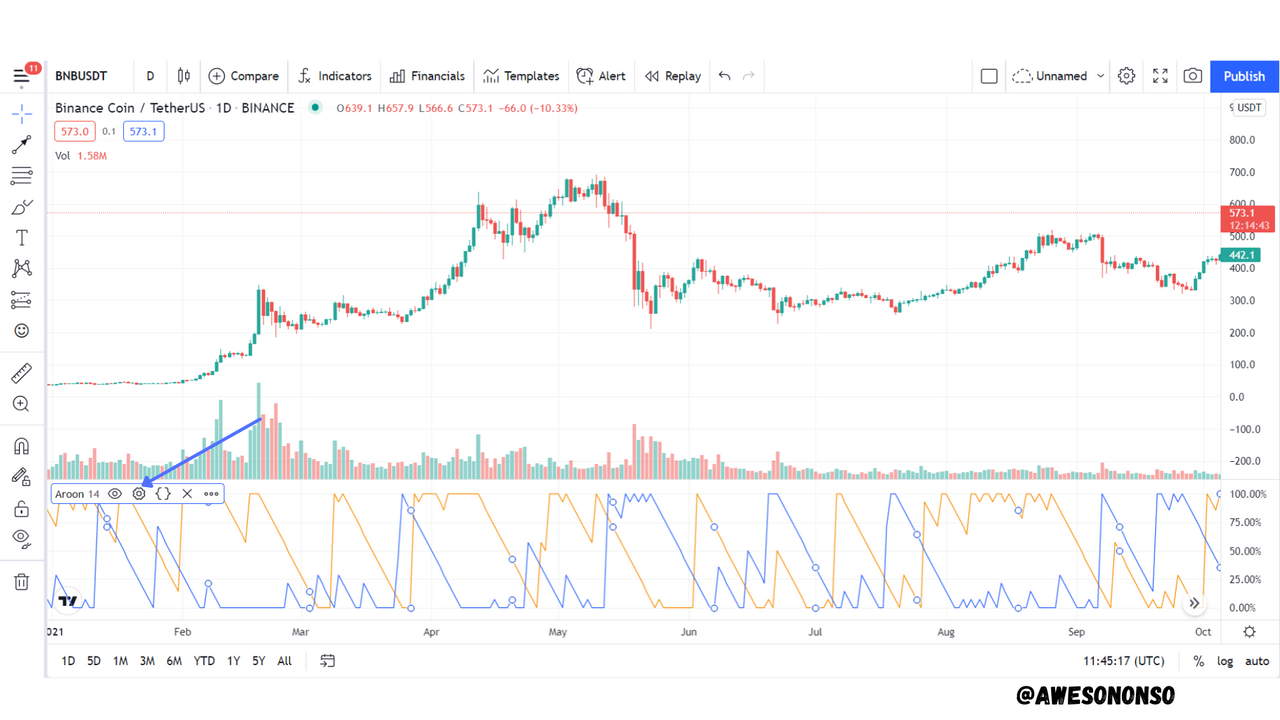
a) For the inputs section we have the following;
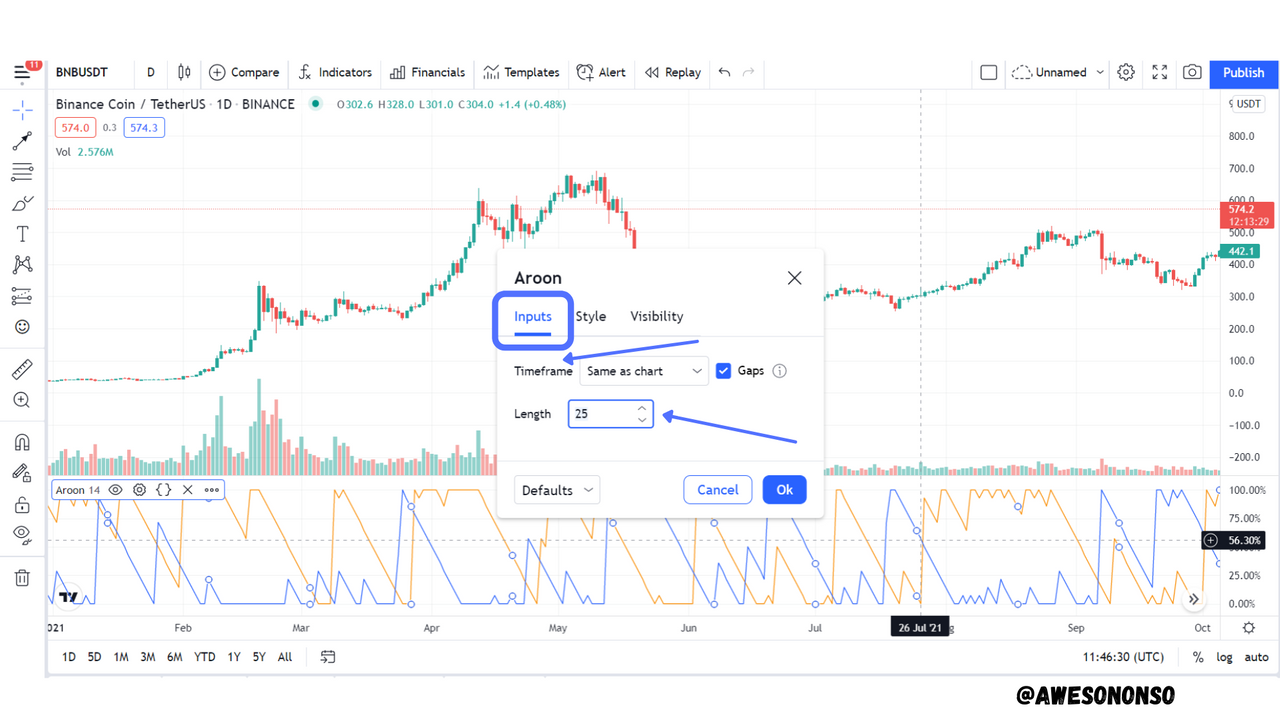
Timeframe defines the timeframe the indicator would follow.
Period indicates the number of periods, N, taken into consideration. This can be minutes, hours, days, etc. The default is 14 but I have changed it to 25.
b) For the Style section we have the following;
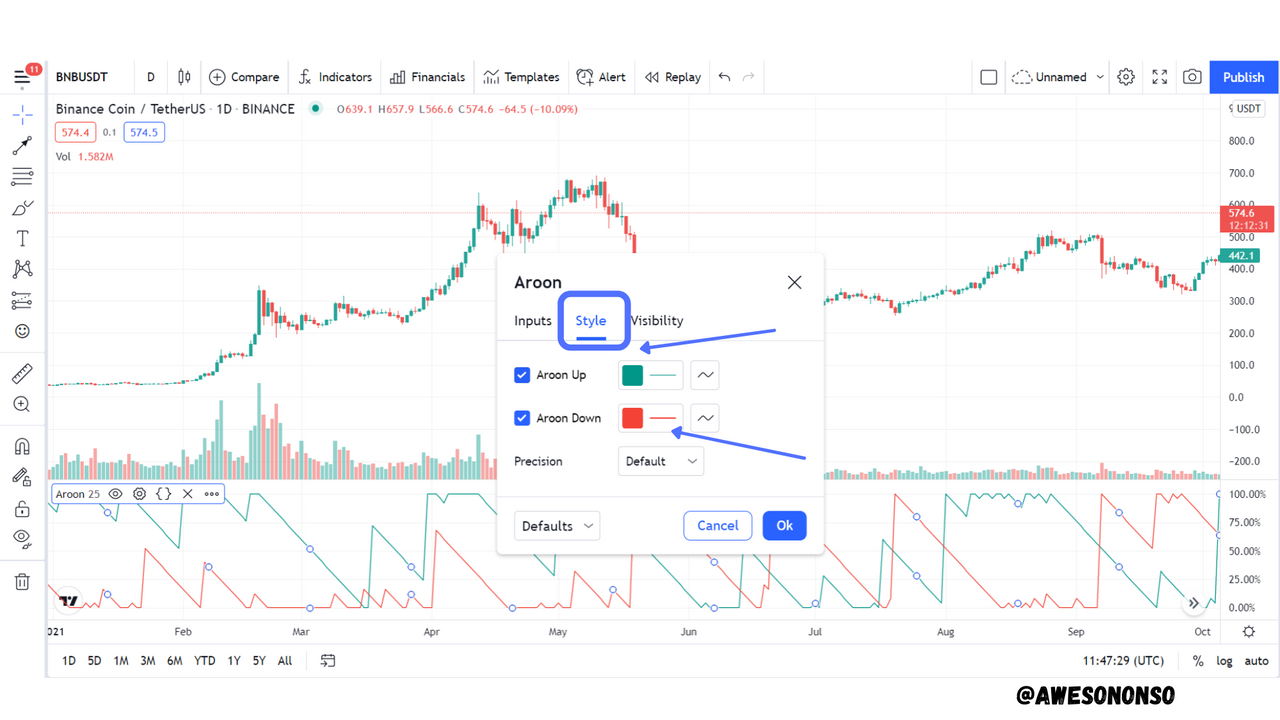
Here we can edit the colours of the lines. The default was red for Aroon-up and Blue for Aroon-Down but I changed them to avoid confusion.

4. What is your understanding of the Aroon Oscillator? How does it work? (Show it on the chart, kindly skip the steps involved in adding it).

The Aroon Oscillator was also developed by Tushar Chande in 1995. Just like the indicator, it determines the direction of a trend and the strength of the trend. As an oscillator, it includes one line that oscillates between the values of -100 and 100. Positive values indicate an uptrend while negative values indicate a downtrend. Crossovers at the 0 line can be used to determine possible trend reversals.
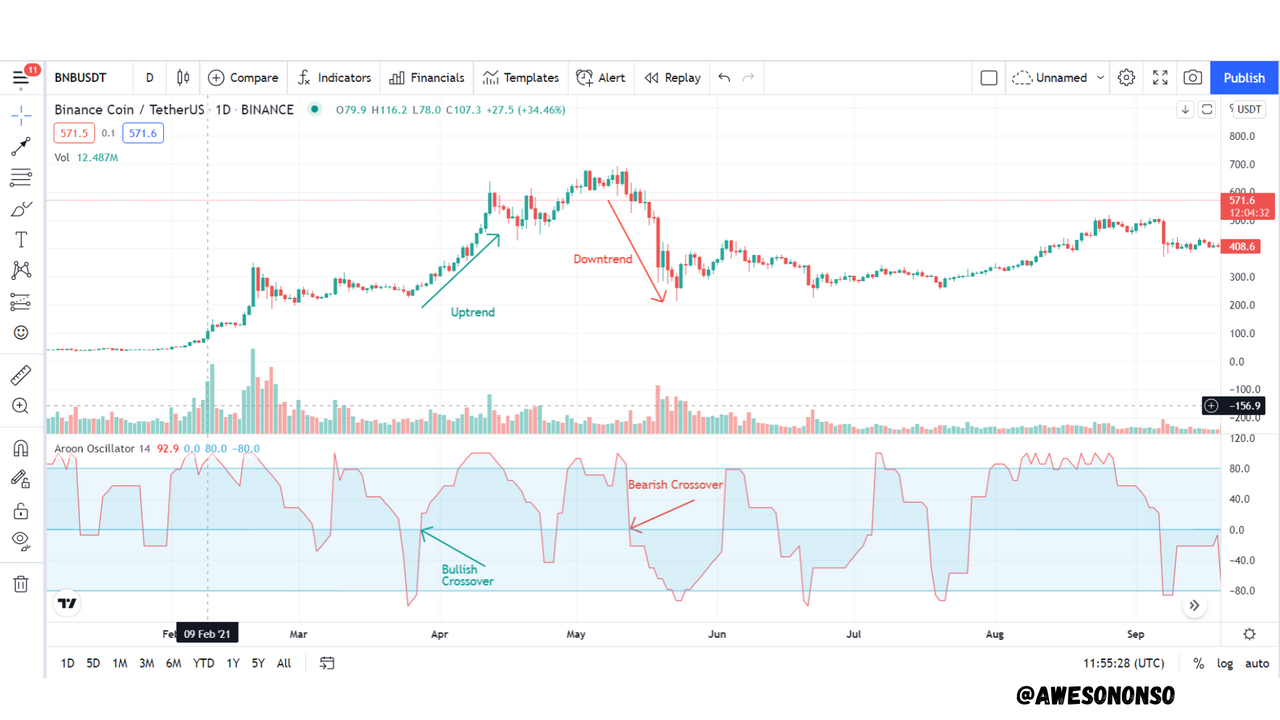
The Aroon Oscillator tool inculcates the properties of the the Aroon indicator in it. The Oscillator is just the difference between the Aroon-Up and Aroon-Down lines. The formula is given as;
The Oscillator comes in a default period of 14 just like the indicator. To use the oscillator properly, it is important to set its period the same as the indicator. In the example below, the indicator and oscillator are set to a period of 25.
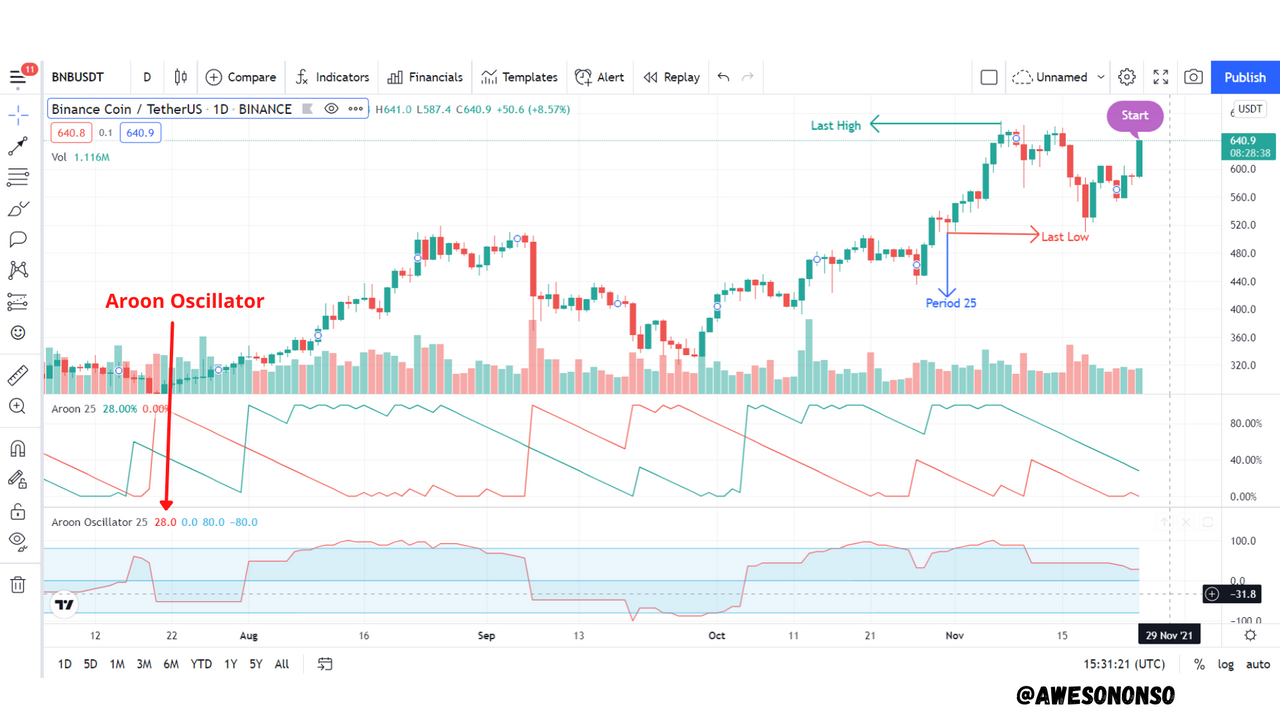
Aroon-up = 28
Aroon-Down = 0
Aroon Oscillator = Aroon Up - Aroon Down
= 28 - 0
= 28 (as indicated above)

5. Consider an Aroon Indicator with a single oscillating line, what does the measurement of the trend at +50 and -50 signify?

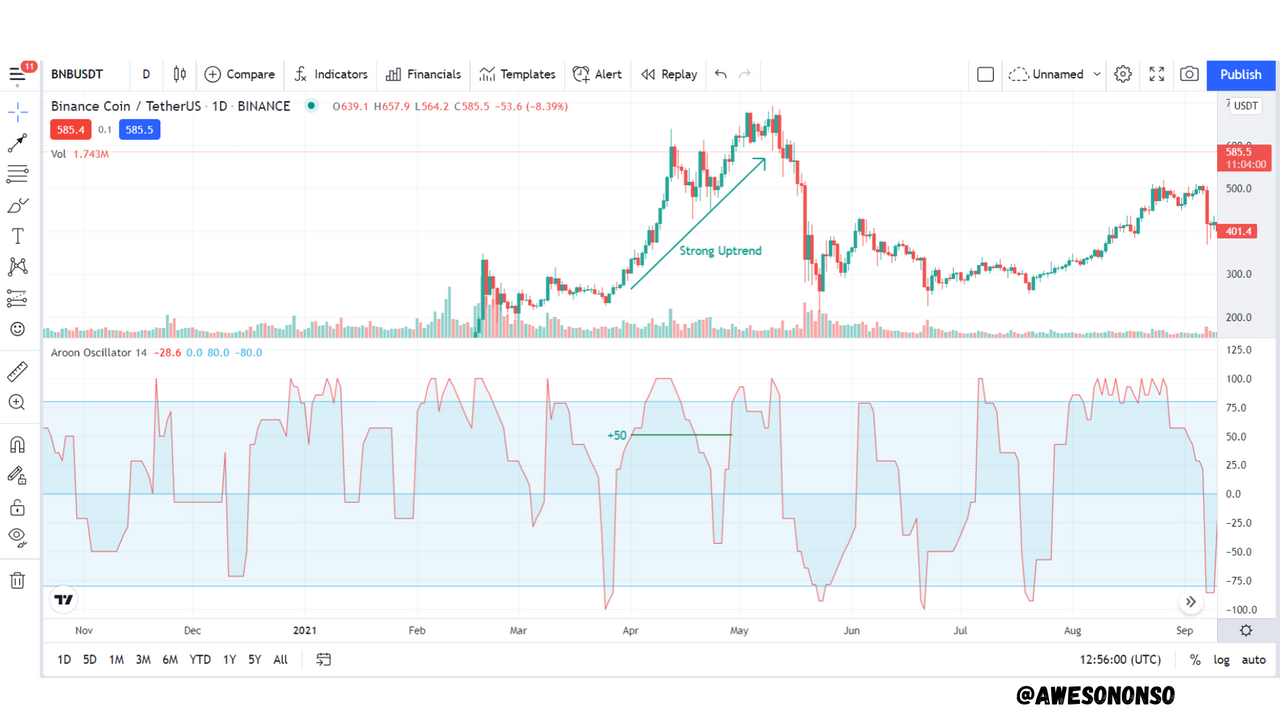
As mentioned earlier, the Aroon Oscillator determines the strength of a trend. At +50, the bullish trend is strong and more likely to continue.
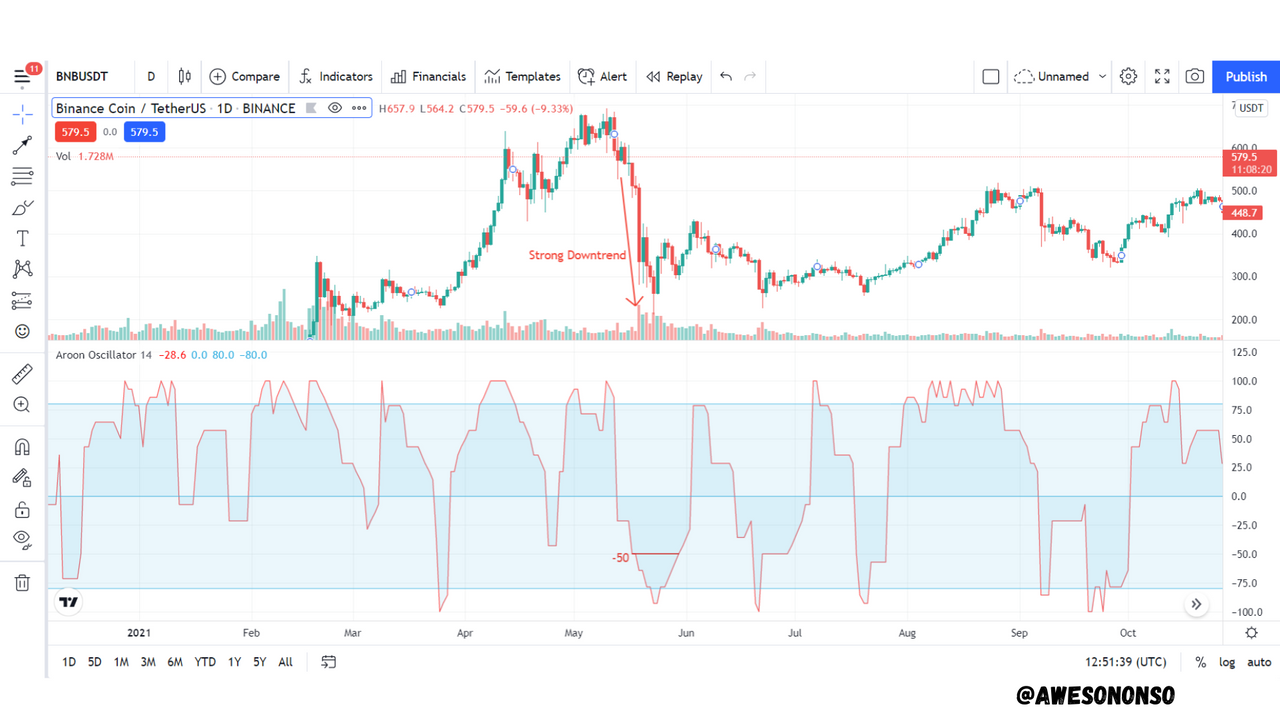
Similarly, at -50, the bearish trend is strong and more likely to continue.

6. Explain Aroon Indicator movement in Range Markets. (Screenshot required).

A range market, popularly known as a sideways market, is a type of market that is not trending. The market is neither bullish nor bearish. This type of market can be confirmed with the Aroon indicator.
In a range market, the Aroon-Up and Aroon-Down move in a parallel-like manner. The parallel movement does not necessarily mean a clear side-to-side movement but one with no crosses. Any cross that happens would indicate the start of a trend. Also, any parallel movement would indicate consolidation at that point.
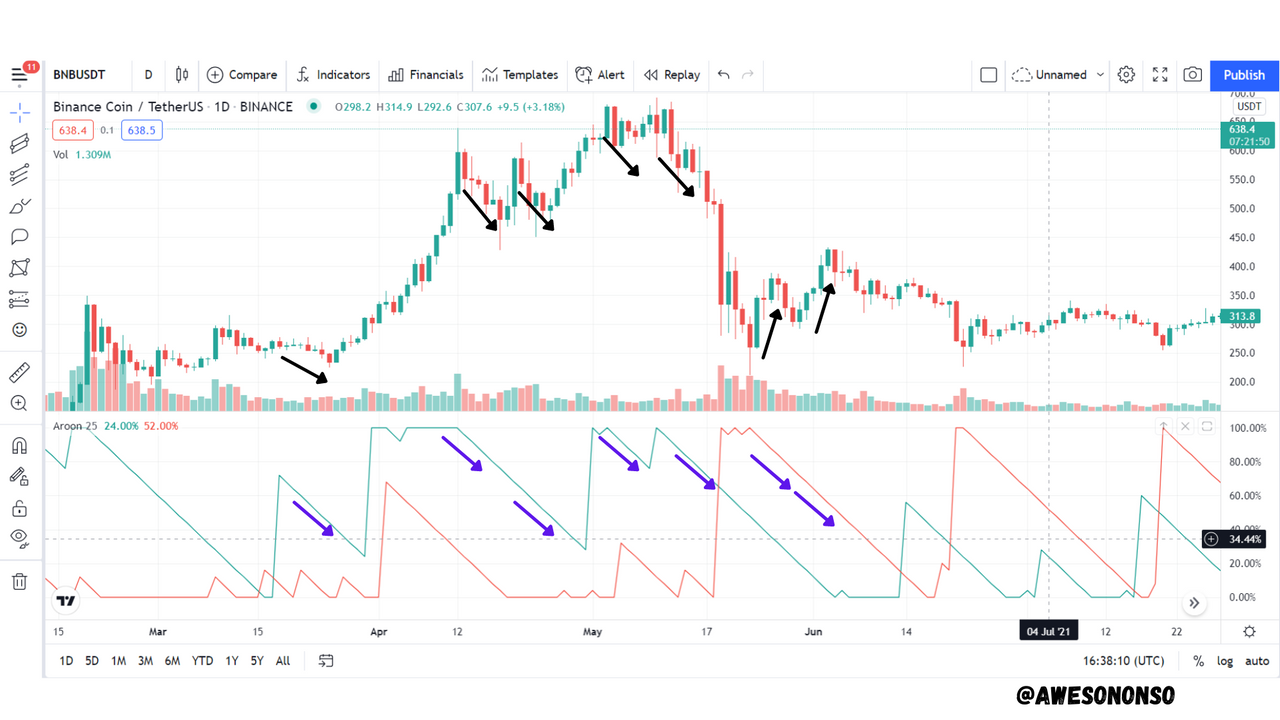
From the image above, the black arrows indicate consolidations from the overall trend (upward or downward). These arrows match the parallel movements of the Aroon lines marked with purple arrows.

7. Does Aroon Indicator give False and Late signals? Explain. Show false and late signals of the Aroon Indicator on the chart. Combine an indicator (other than RSI) with the Aroon indicator to filter late and false signals. (Screenshots required).

Yes the Aroon indicator gives False and Late signals.
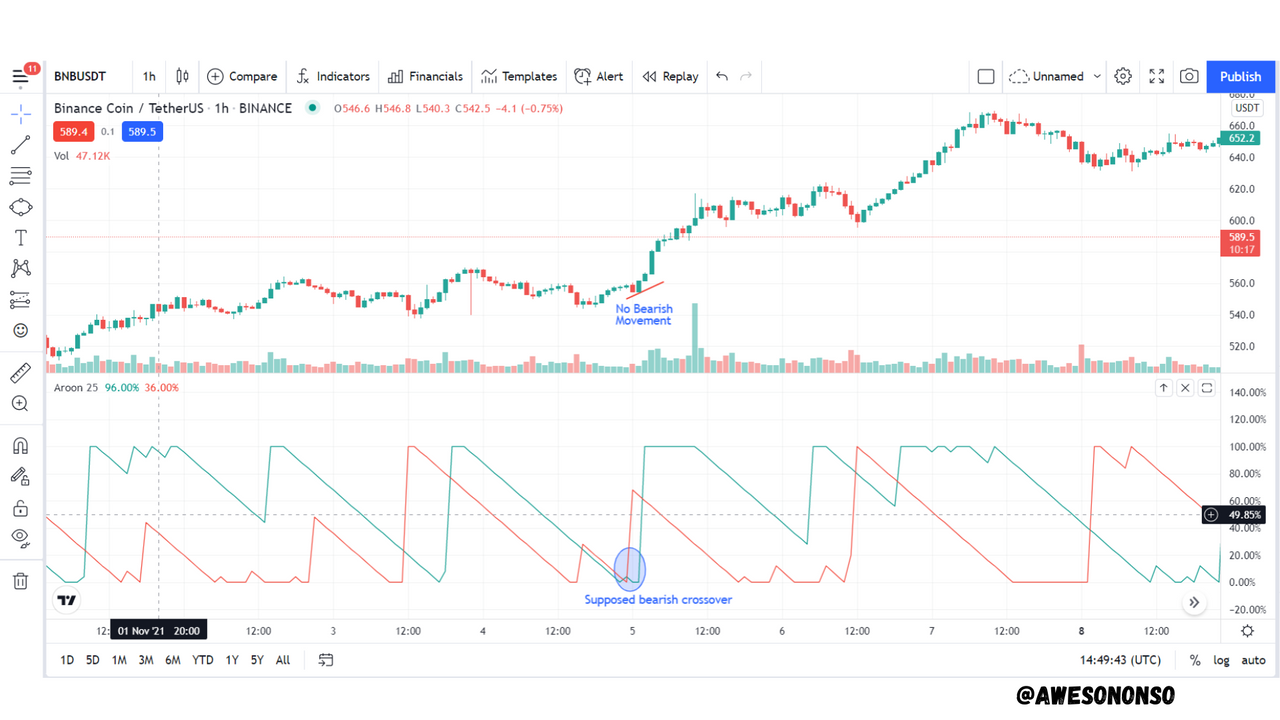
False signals happen when the indicator shows a possible trend change that does not happen. The indicator might show that there would be a possible bullish or bearish reversal from the current trend but that just does not happen. Traders that follow these signals might end up in a lot of loss if proper trade management is not taken.
In the image below, the Aroon-Down crossed the Aroon-Up upwards. This would normally indicate a bearish trend but that does not happen on the candlestick chart.
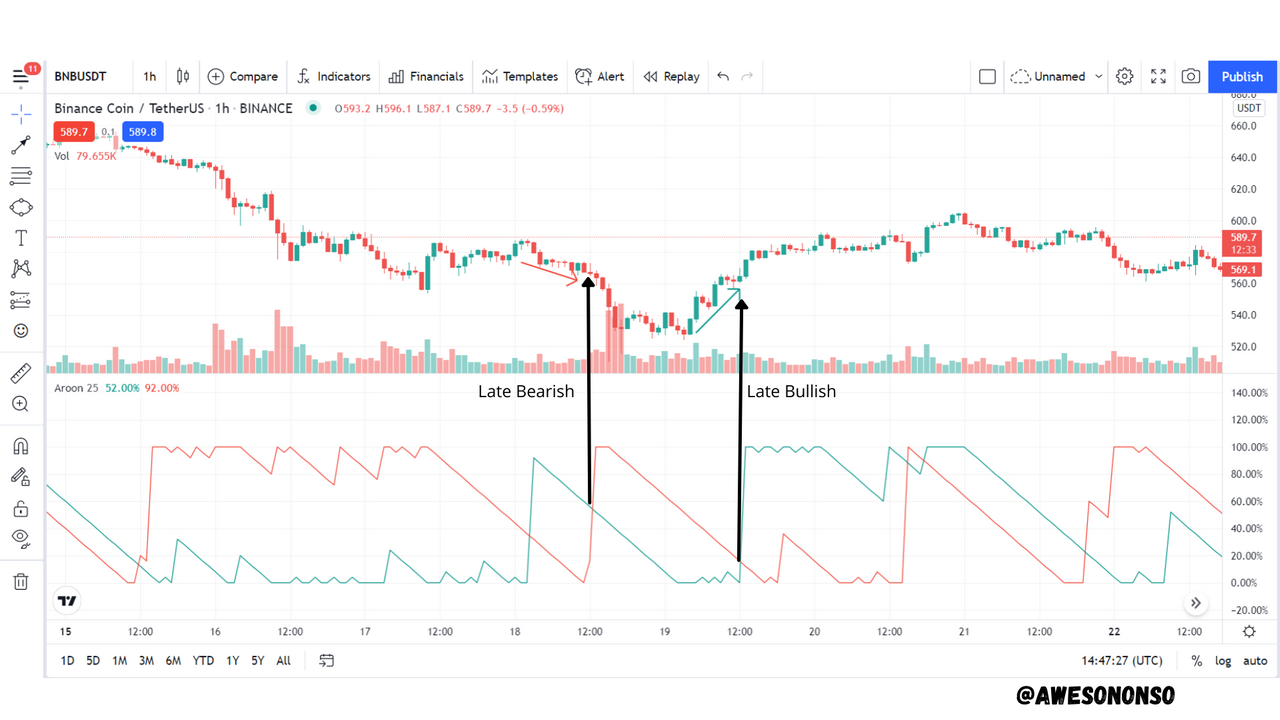
Late signals happen when a trend has already began before the indicator confirms it. In this case, traders do not make the best entry positions.
In the image below, the Aroon-Up crossed the Aroon-Down upwards to indicate a bullish trend and therefore a buy signal. The signal came late however because the trend had already began. Traders that place buy orders at this point will not make as much profit as they should. This is also the same for the sell signal indicated before that.
Combining the Aroon indicator with an EMA
The Aroon indicator can be combined with an EMA to make more accurate trading decisions. I will use a 20 period EMA to complement the lagging of the Aroon indicator.
For the False signal:
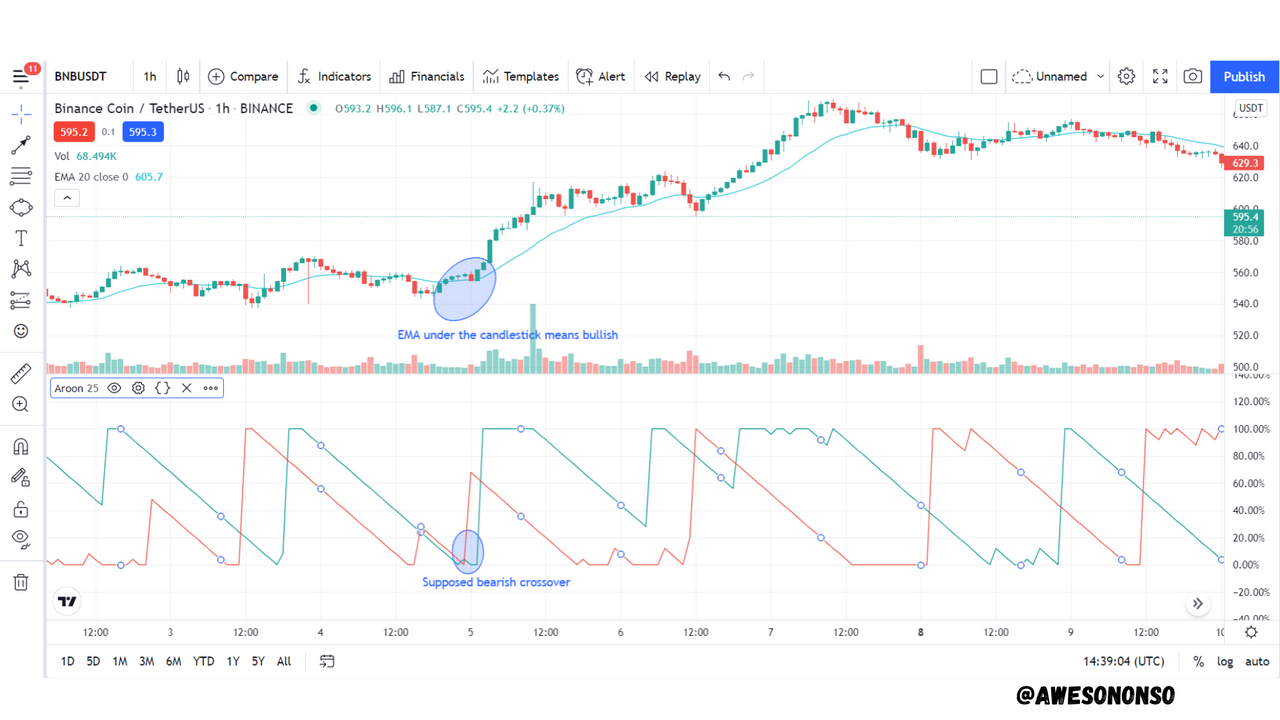
Where the Aroon indicator showed a possible bearish crossover in the image above, the signal turned out to be false. Using the 20 period EMA, there was no indication of a bearish movement. In fact, the EMA remained under the candlestick as a dynamic support and so signaling a possible bullish movement.
For the Late signal:
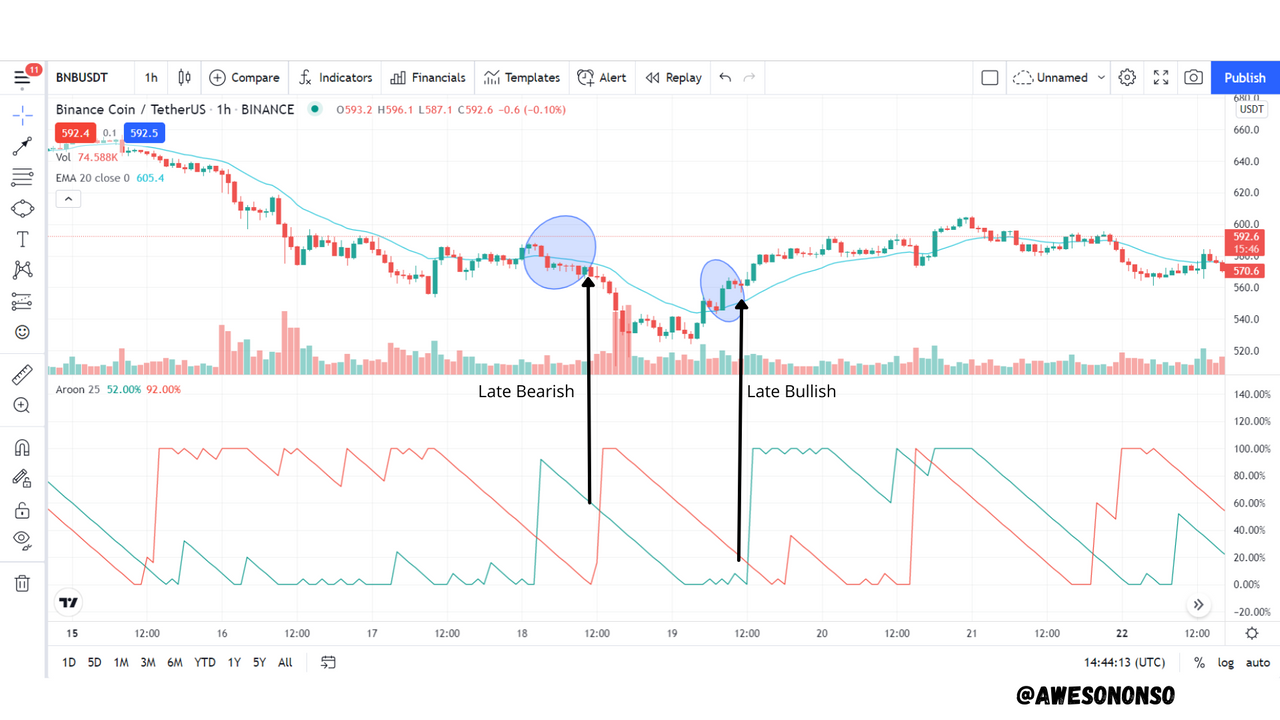
For the bearish and bullish trends indicated, the EMA was quicker to show these movements by a few pips before the Aroon indicator lines crossed.

8. Place at least one buy and sell trade using the Aroon Indicator with the help of the indicator combined in (7) above. Use a demo account with proper trade management. (Screenshots required).

Buy Trade
I will be trading with the BNB/USDT pair
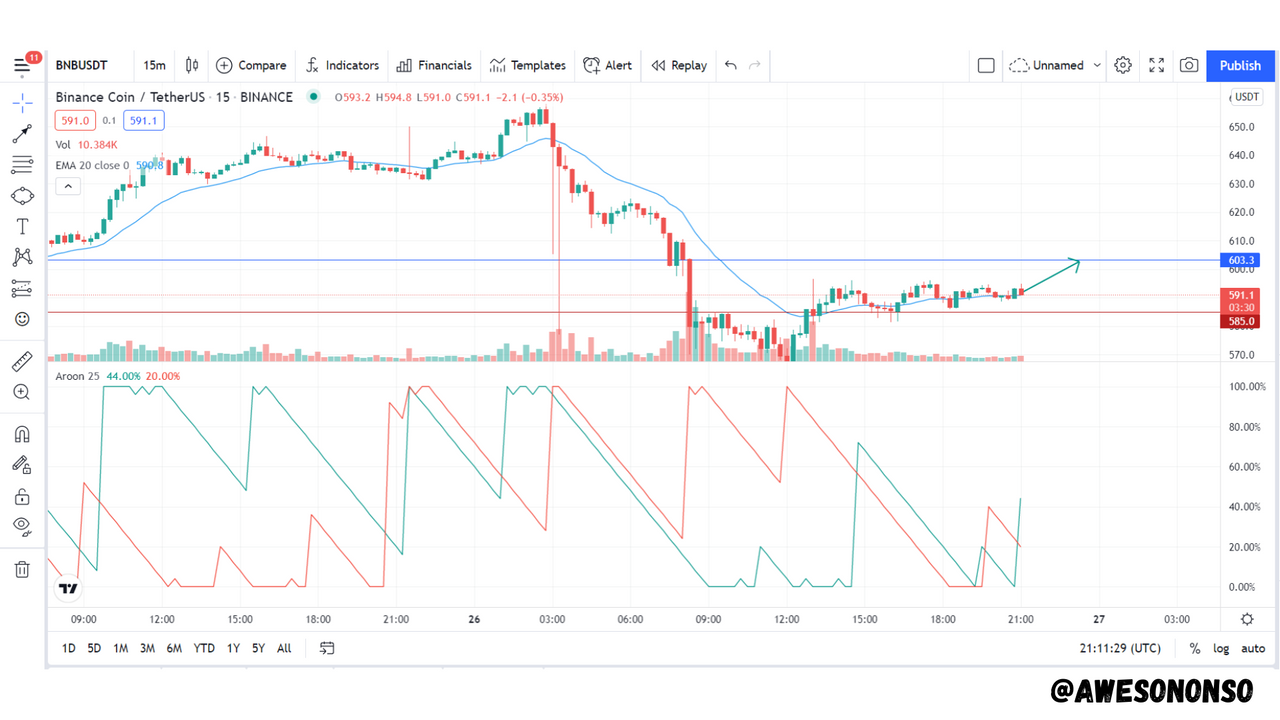
From the image above, the Aroon-Up had crosseed the Aroon-Dwon which should signify a buy signal. Looking closely, the EMA was below the candlesticks meaning that it was a support.
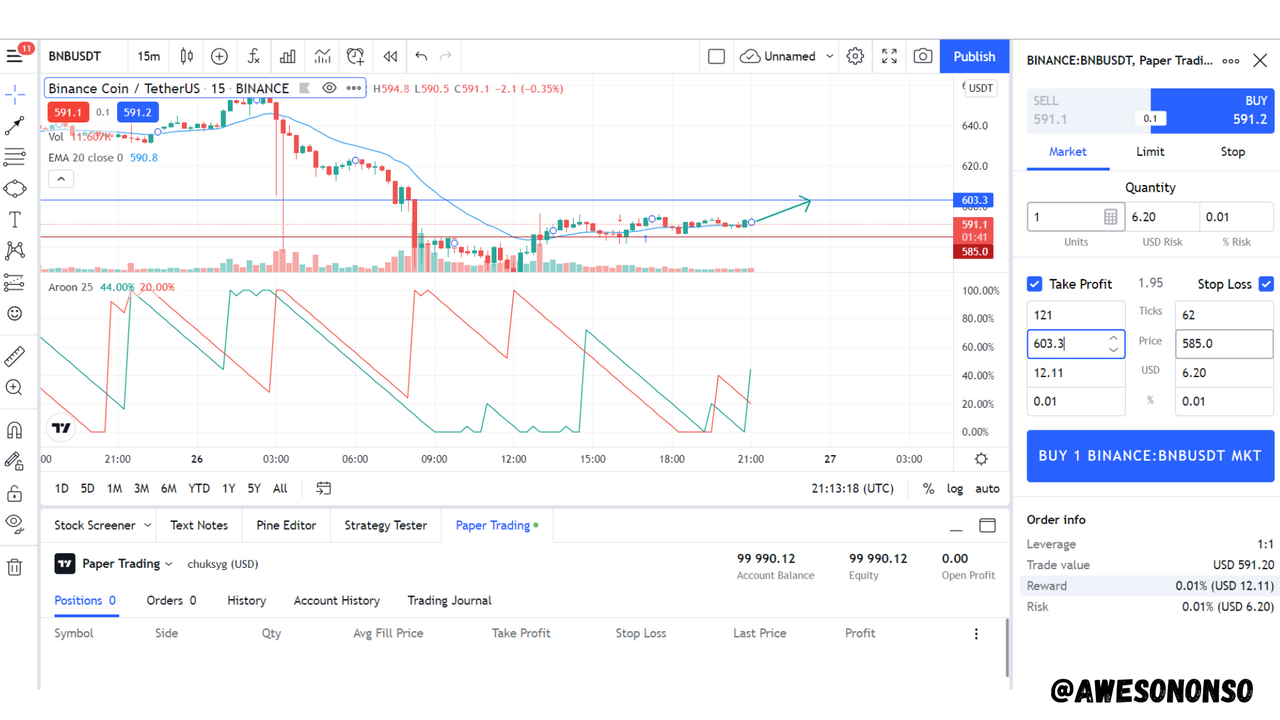
I placed a buy order at that point with Take profit of 603.3 and Stop-Loss of 585.0. The order was opened.
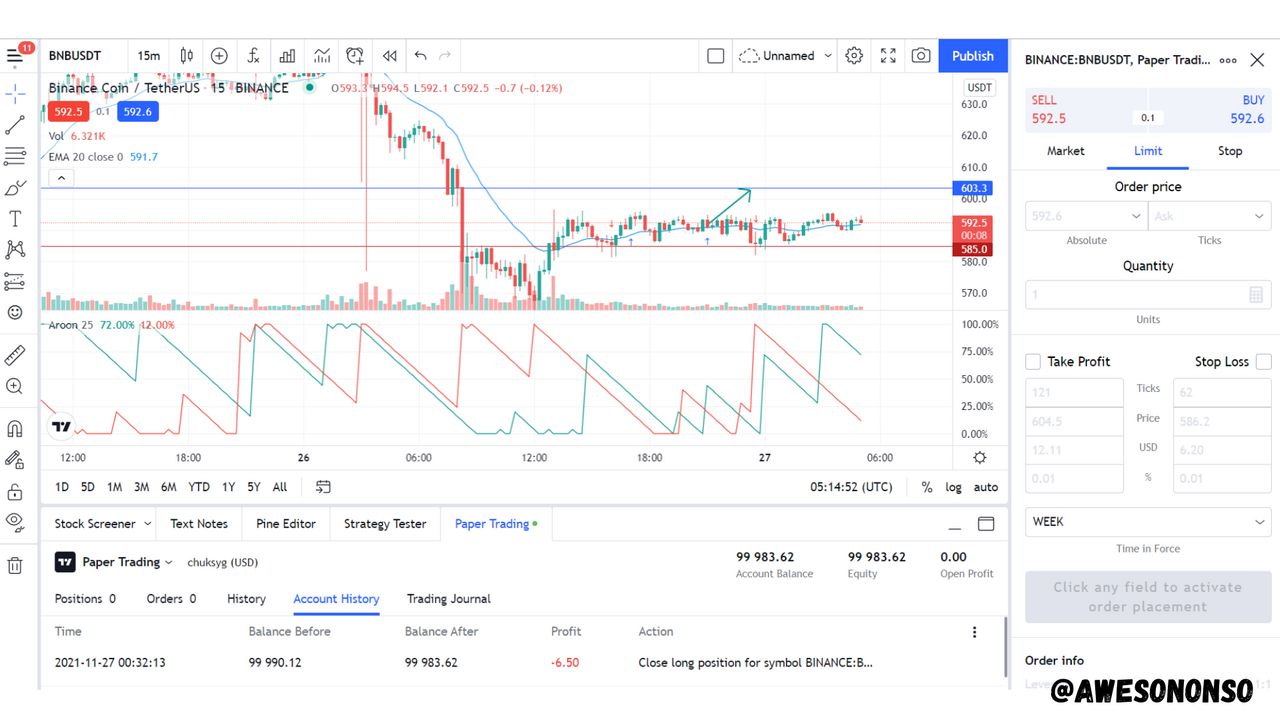
Unfortunately the trade ended at a loss after it hit mu stop loss.
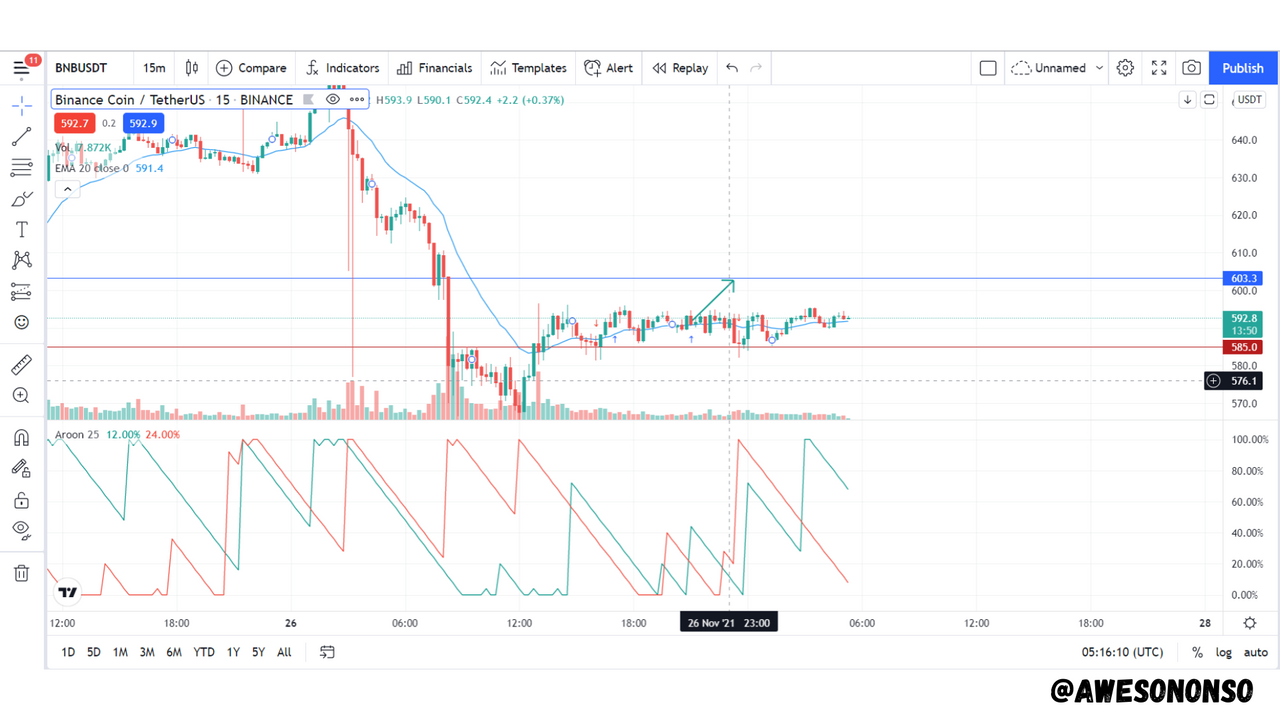
Sell Trade
I will be trading with the BNB/USDT pair
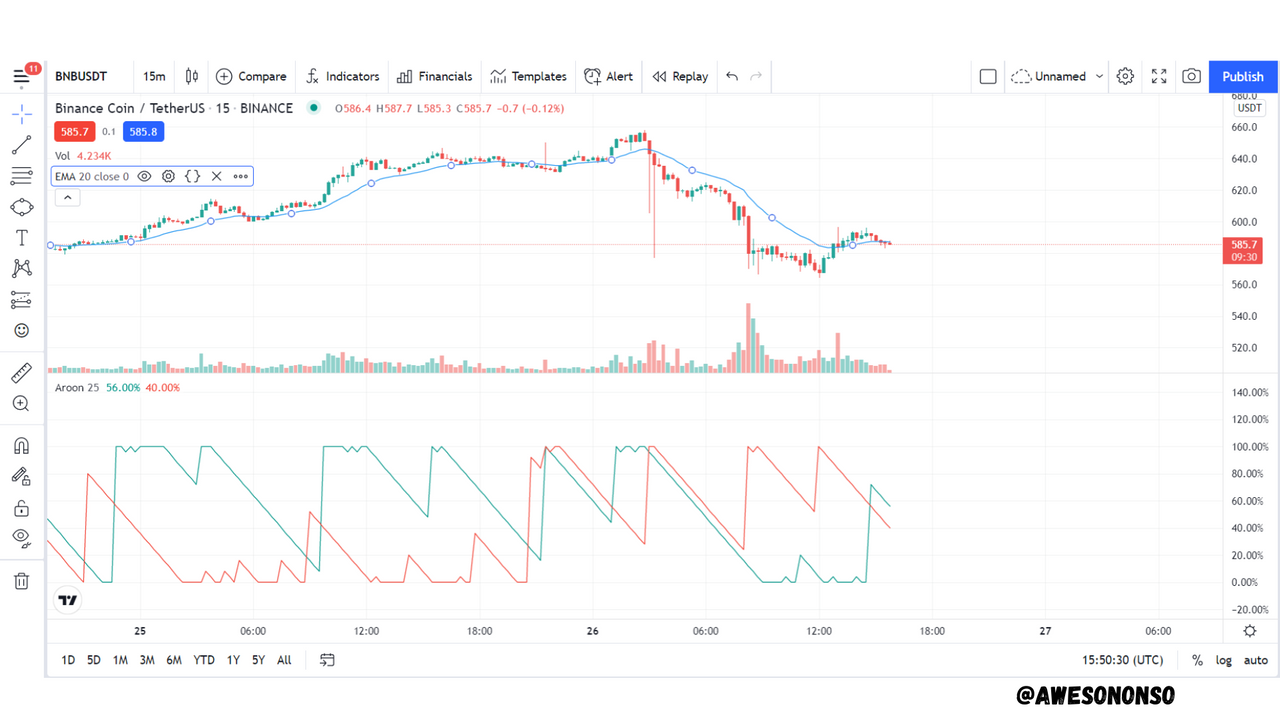
From the image above, the EMA is going above the candlestick. It should be a good sign for a sell entry. There is no cross of the Aroon lines but the lines are parallel which shows a possible retracement in that direction.
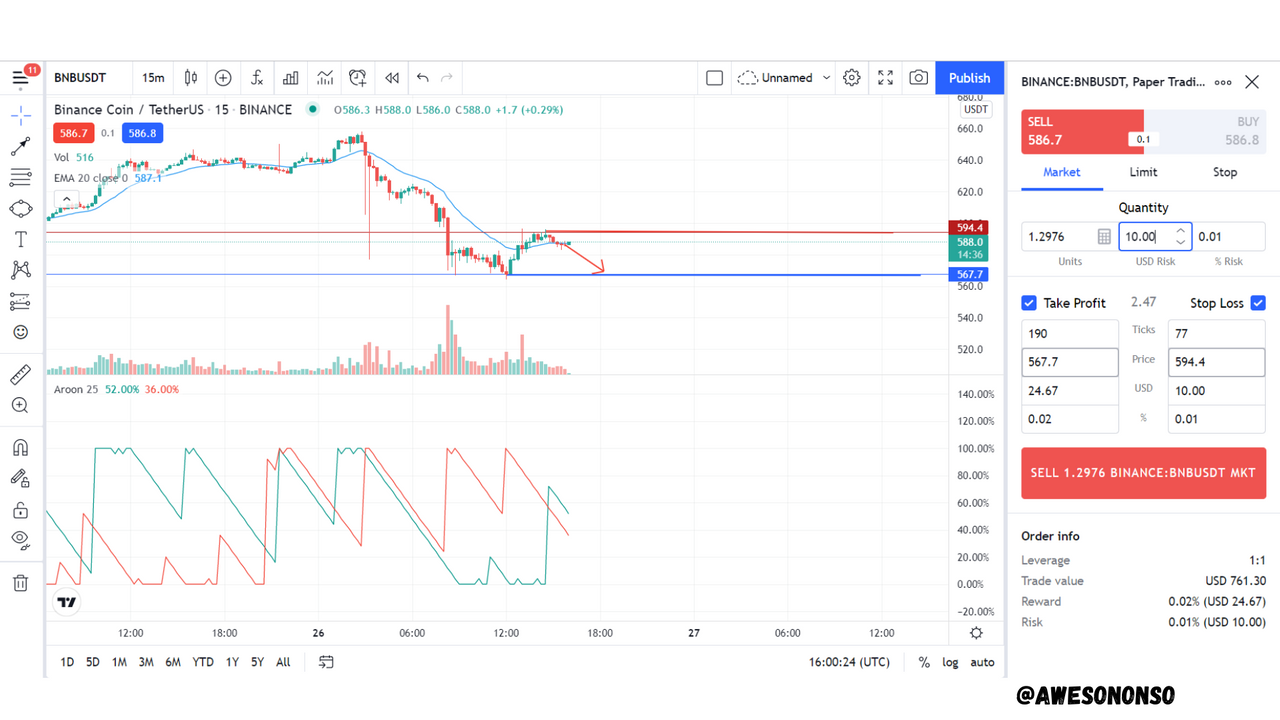
I placed the trade with Stop Loss of 594.4 and take profit of 567.7.
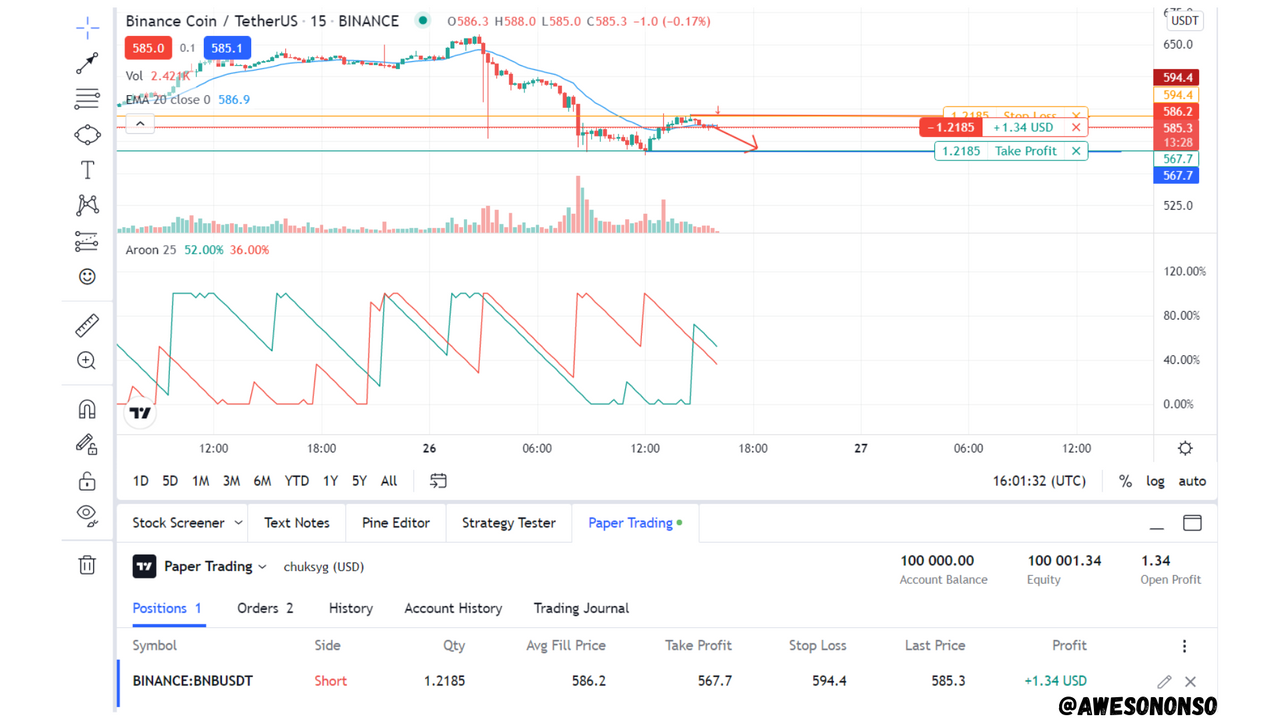
The trade is open.
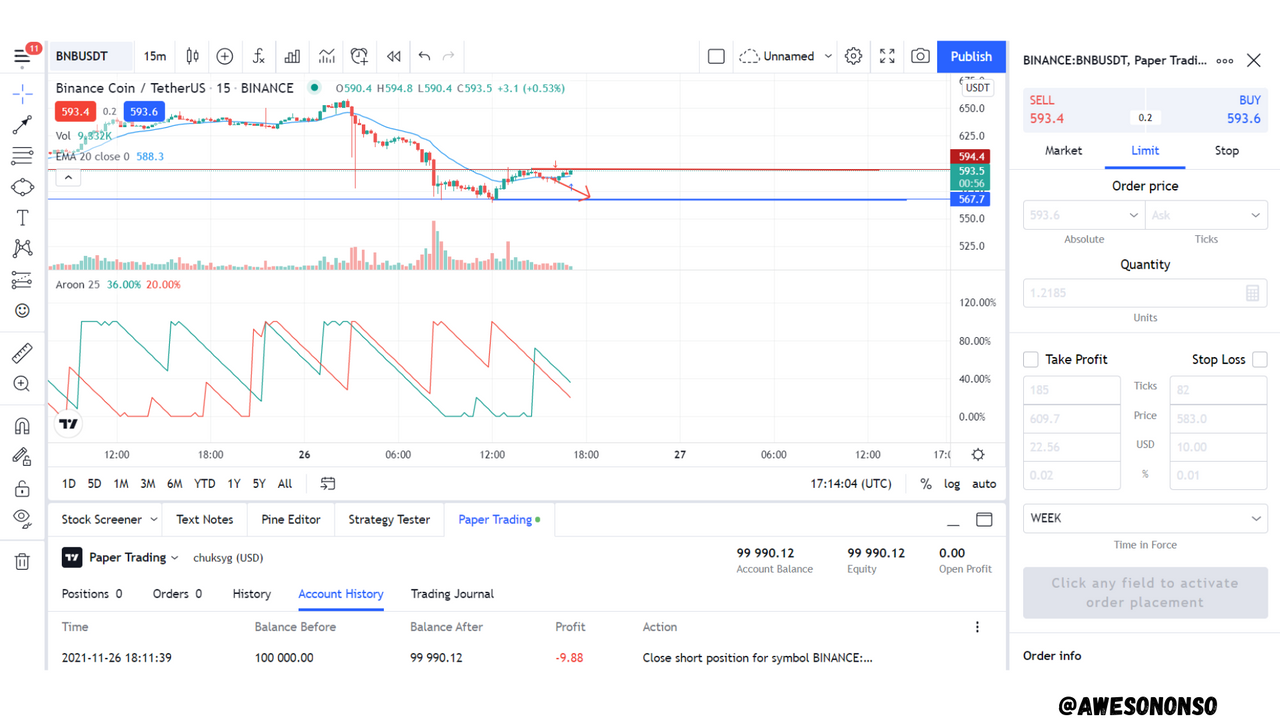
From the image above, Unfortunately the trade did not go my way.
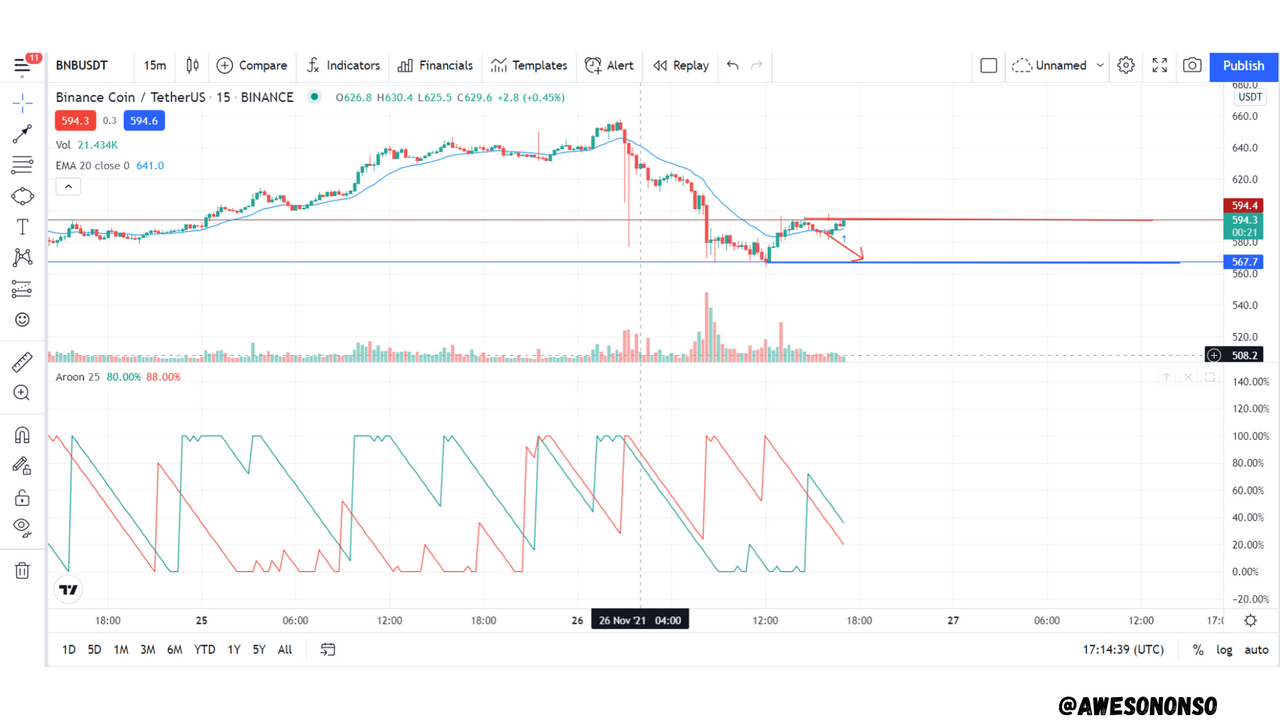
As you can see above, it closed at my stop loss. I guess it isn't my lucky day at all. This is why trade management is important.

9. State the Merits and Demerits of Aroon Indicator.

Merits
i.) The indicator can be used to determine the strength of a trend for a more accurate trade.
ii.) It can be used in a sideways market as well as a trending one.
iii.) It is very easy to understand and use.
iv.) Its lines are quite easy to calculate.
Demerits
i.) The fact that it gives late signals means it does not help traders maximize profits.
ii.) The false signals can cause a huge amount of loss while trading.
iii.) It should not be used alone.

Conclusion

The Aroon indicator might not be as popular as the Stochastic or RSI but it is quite important in technical analysis. For me, its biggest pro is that it can be used to measure the strength. That alone can boost the certainty of a trade going a particular way. Nonetheless, just like any other indicator, it should be used with caution in order to avoid costly mistakes just like the trades above.
