

1- Introduce Leverage Trading in your own words.

Original Source
When talking of leverage trading, it's a type of trading technic which usually enable traders to have a high power of purchasing a crypto asset in the market with just little capital they have and this type of trading is similar to that of margin trading because both involves investing but the only difference between this two type of trading is that traders in margin trading require the use of collateral in the margin account so as to borrow funds from any broker and this borrowed funds are usually paid with interest while leverage trading is the proportion between the invested money and the amount of money that is allowed in other to perform a trade after taking on the debt. The leverage trading involves a lot of questioning at times in some platforms so as to ensure that the trader is a professional and therefore understand the risk involves in carrying out this trading
One good thing about this leverage trading is that it's a popular type of trading for professional traders because of it's good risk management that usually enables traders to have a successful journey in crypto trading because they understand. This type of trading is extremely very dangerous for beginners especially if they don't understand technical analysis that much. Pro traders can trade many types of crypto coins with an amount of additional coins which is usually provided to traders by the exchange platform. In this leverage trading, users can purchase up to 100 times greater than the initial amount in the capital which is extremely advantageous to leverage traders because a trader with $20 can be be able to to purchase an asset 2000x that of their trading capital
Leverage Trading Operates in two ways which are either buy long or sell short positions and a sell short position can be performed simply by taking the profit by decreasing the market while buy long position can be performed simply by taking the profit by increasing the market
2- What are the benefits of Leverage Trading?
Even though there is risk involves in carrying out leverage trading just like any other type of trading, it also have a lot of advantages which I will be explaining them below
1: In shorting the market during leverage trading, traders can use the products of leverage so as to speculate the movement of the market thereby taking advantage and benefiting from both the rising and falling markets.
2: In leverage trading, traders can be able to free up their capital which could be committed to other investment hence can take the advantage to increase the amount which is available for their investment.
3: Leverage traders can be able to borrow a considerable amount of money in other to use it as a multiplication of their initial investment.
4: Leverage traders can be able to make huge profit by analysing the chart properly at a very short time frame of 5Min and below. This therefore implies that leverage traders are mostly involve in scalp trading because they can make a very fast profit within a short time frame.
5: In leverage trading, traders usually have high purchasing power just with little capital because they can purchase any crypto asset at 100 times that of their trading capital
3- What are the disadvantages of Leverage Trading?
Despite the advantages and benefits of leverage trading, it also have disadvantages just like any other type of trading which I will be explaining them below
1: In leverage trading, traders usually have to pay additional fees even after paying the usual trading fee. This additional fees are usually the funding fees which may enables a traders liquidation point to increase as days go ahead because of certain movements in the market which was not expected by the trader
2: This type of trading is extremely very risky because a leverage trader may eventually lose all his trading capital should incase things go wrong in the market. This implies traders need to be extremely careful when carrying out this type of trading. We see here that only traders that are professional can benefit in the type of trading because of their knowledge and experience in the market.
3: In leverage trading, a trader is charge just by holding trades overnights even after paying the the Normal trading fees which is extremely very disadvantageous to traders because it's not thesame in the case of spot trading because a spot trader can hold his trades for days or even months without being charged.
4- What are the Basic Indicators that we can use for Leverage Trading? (Need brief details for any essential Indicators and their purposes)
In leverage trading, it is necessary for traders to be able to know the types of technical indicators that are good to use when carrying out technical analysis to predict future price of an asset in the market. So I will be giving brief explanations for some of this indicates Below
Parabolic SAR
This is a very popular indicator use by technical Analyst and traders because it is usually use to watched out for price reversal and trend direction in the market. Traders can be able to take good entry positions in the market using this indicator because when ever the dots is above price level, it tells traders that the market may start moving down trend and when ever the dots is below price level, it tells traders that the market may start moving uptrend
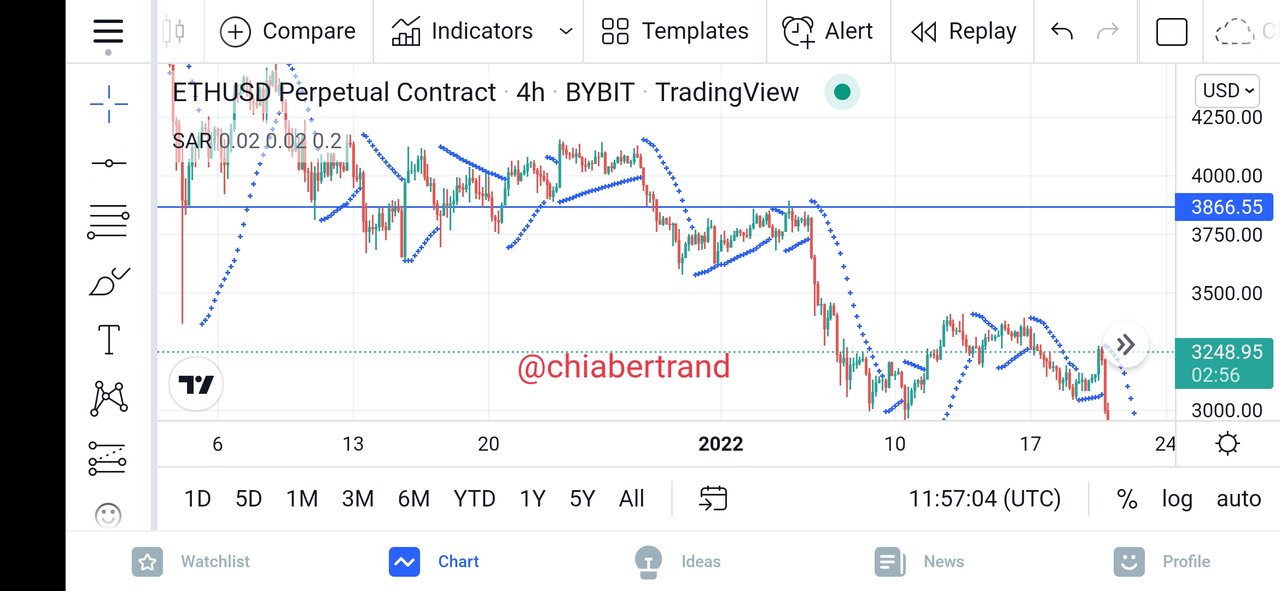
Screenshot taken from tradingview.com
Exponetial Moving Average (EMA)
This type of indicators is also very popular and it is widely use by technical Analyst and traders so as to watched out for the trend of the market by focusing more on the changes of recent price of a crypto asset in the market. We can use this Indicator in leverage trading by configuring it's length to 200 periods so as to be able to identify both buy and sell opportunities clearly in the market.
When ever this indicator line is moving above the market, it signifies to traders that its a good opportunity to make a buy entry. When ever this indicator line is moving below the market, it signifies to traders that its a good opportunity to make a sell entry.
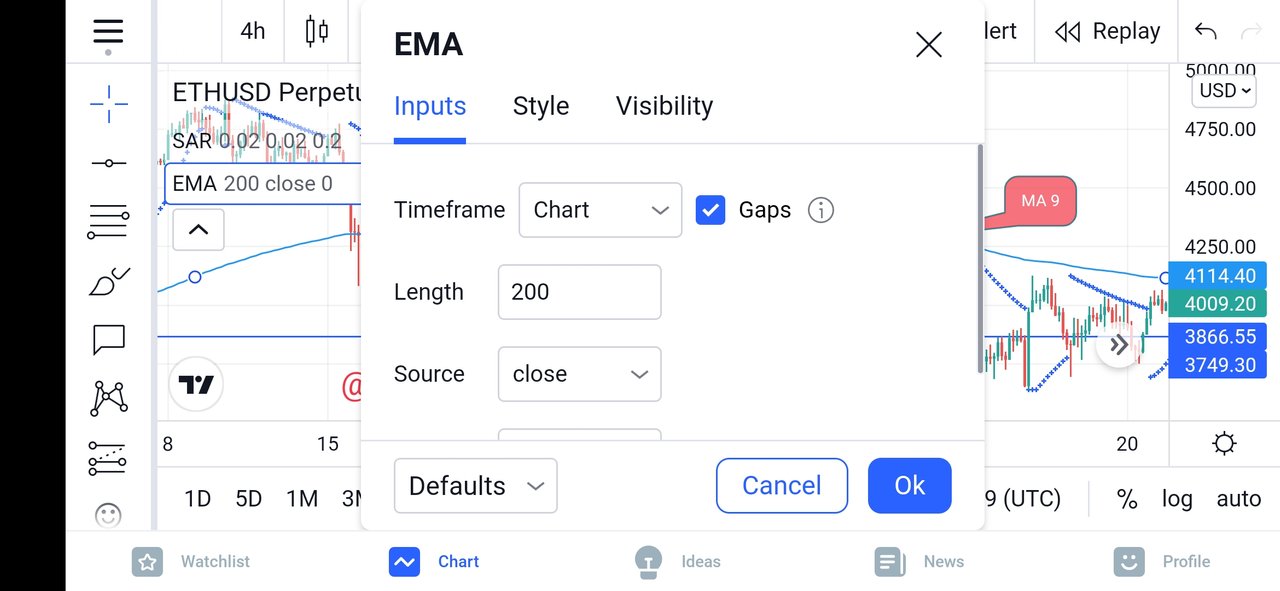
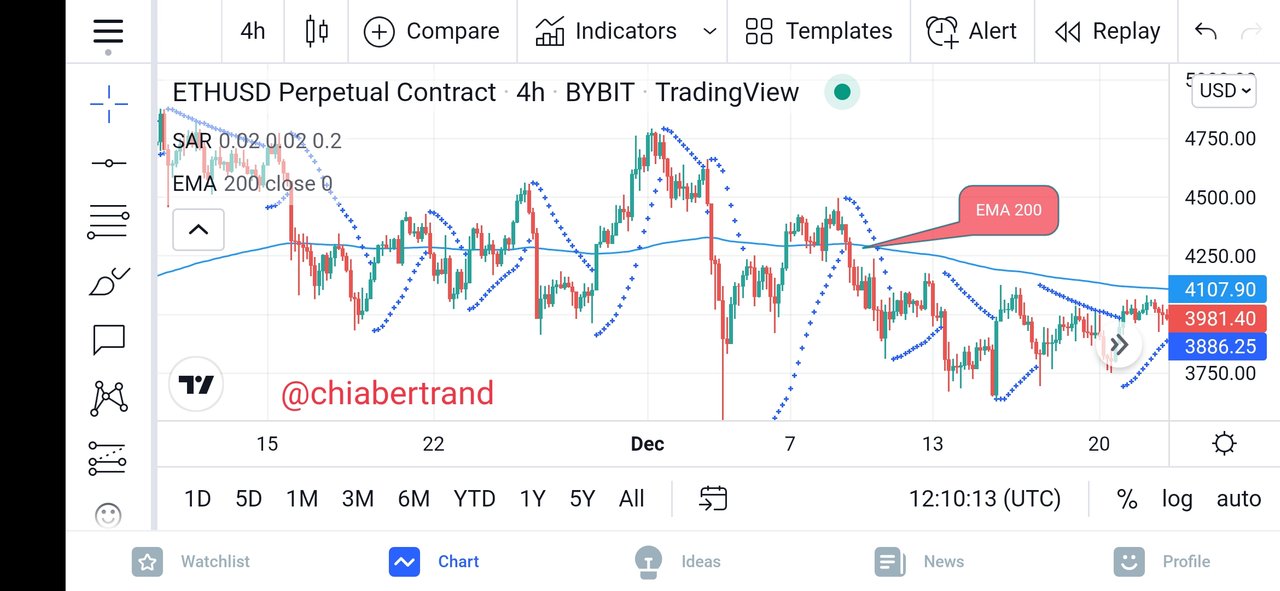
Screenshot taken from tradingview.com
Relative directional index
This type of indicators is also very popular just like the parabolic Sar and EMA and it is widely use by technical Analyst and traders to identify divergence and then determine both the overbought and oversold points in the market. This is Indicator can also be use to identify price reversal in the market and when ever the indicator enters a region below 30 mark(oversold region), it will start Indicating both exhaustion and weakness in the ongoing downtrend in the market. when ever the indicator enters a region above 70 mark(overbought region), it will start Indicating both exhaustion and weakness in the ongoing uptrend in the market.
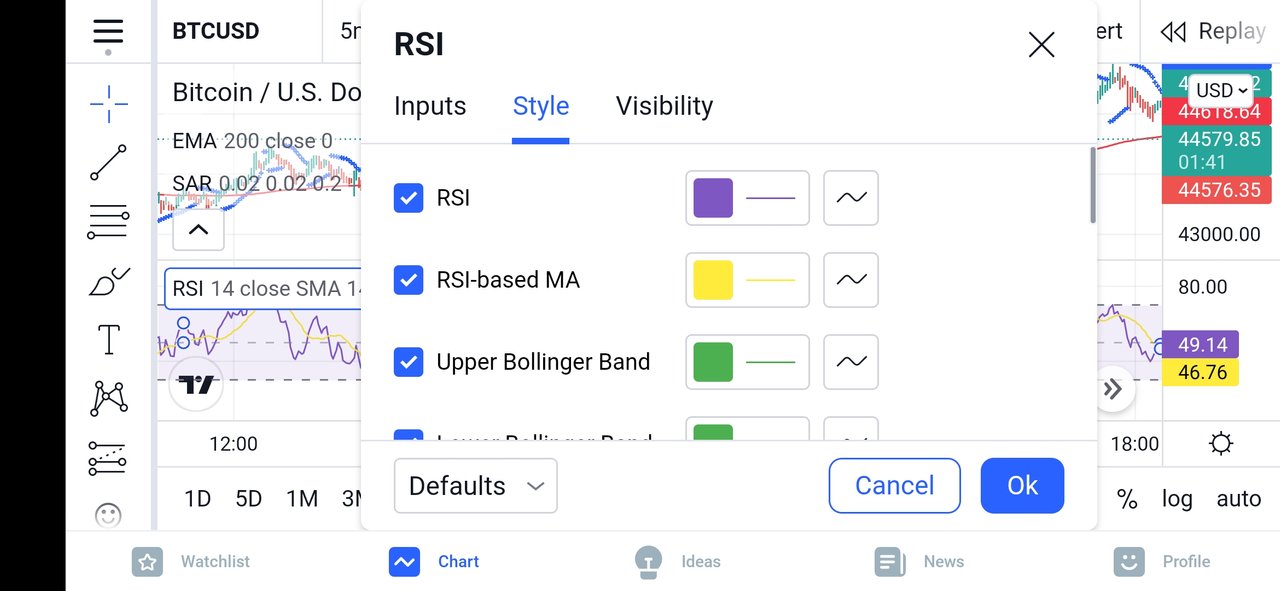
Screenshot taken from tradingview.com
5- How to perform Leverage Trading using special trading strategies (Trading Practice using relevant indicators and strategies, Screenshots required)
Before performing this task, I will have to change my chart from candle chart to Heikin Ashi Charts so as to be able to have a clear identification of the market trends more appropriately. I will also have to change the time to 5MIN timeframe because this type of trading is good for Shorter time frames
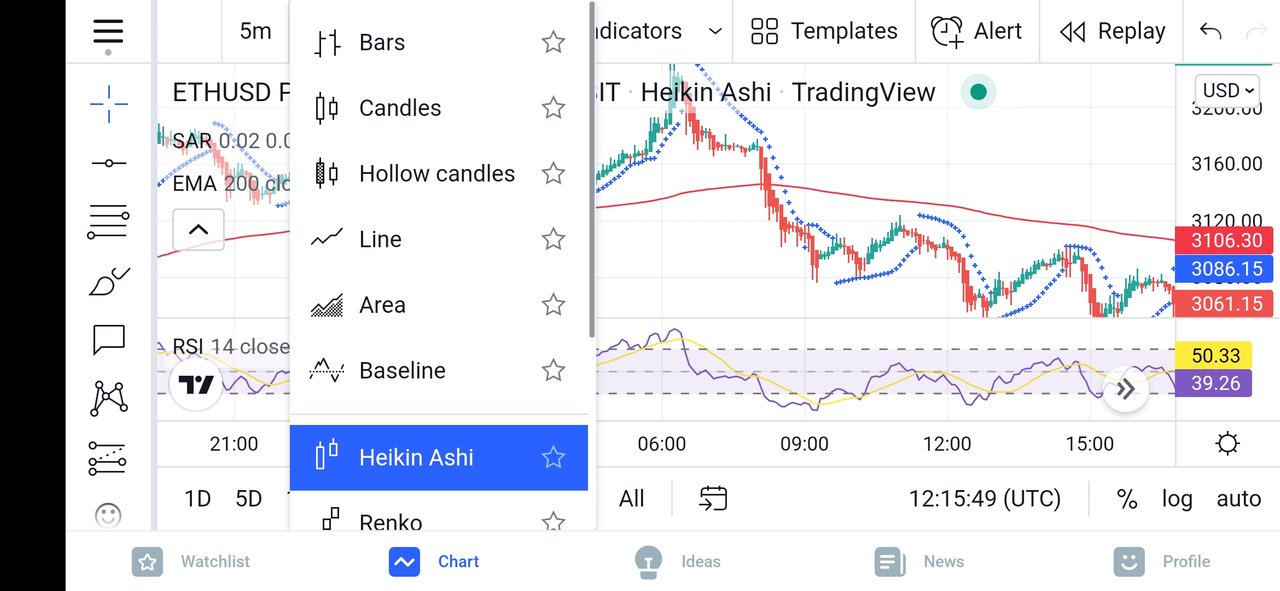
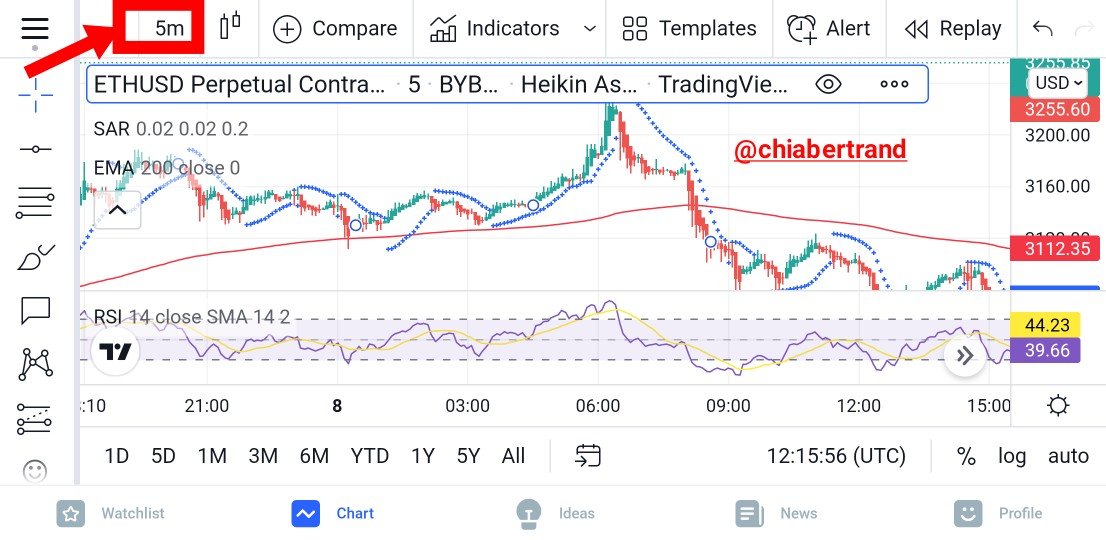
Screenshot taken from tradingview.com
Performing A Buy Long Order Using This Strategy
Trade Entry: What is required here is simply to look for a good and perfect buying position where the EMA indicator is below the price level and then confirm it using the Parabolic Sar by making sure the dots of the indicator is below the price level. We further confirm this buying position by using the RSI indicator by making sure the indicator is below the 50 mark line or at mid band. Once all this criteria is met, we consider this buying position as our entry point
Trade Exit: This is living the market after we most have encountered some profits and what is required is to simply close the market by monitoring any trend reversal dots from the dots of the parabolic Sar by looking at a good support level in the market then use it as our stoploss by taking into account our risk management method
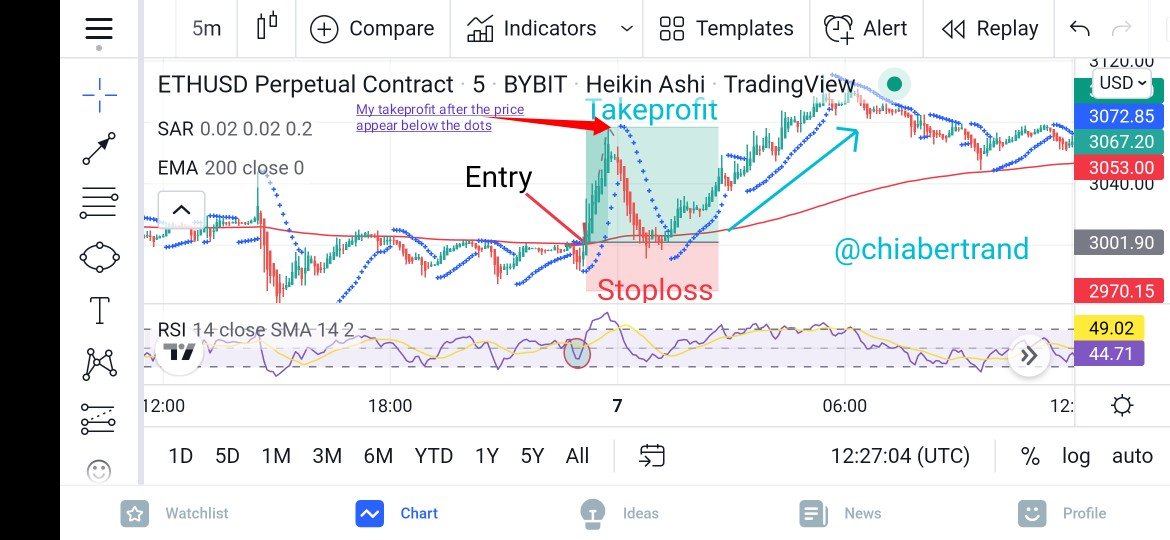
Screenshot taken from tradingview.com
From the ETHUSD chart above, we see clearly that we have been able to identify a good buy long position because the price of the ETHUSD is trading above 200 EMA telling us that it is a bullish. We can also see how the dots from the parabolic Sar is trading below the ETHUSD price by telling us that it's a good point for buying signals. The RSI indicator was found below the 50 mark by futher telling us that it's a good position to enter our buy order trade
I then exit the trade by placing my stoploss Below the dots of the parabolic Sar and the EMA 200 with a takeprofit taken when we see the price appears below the dots of the parabolic Sar then making our proper risk management method
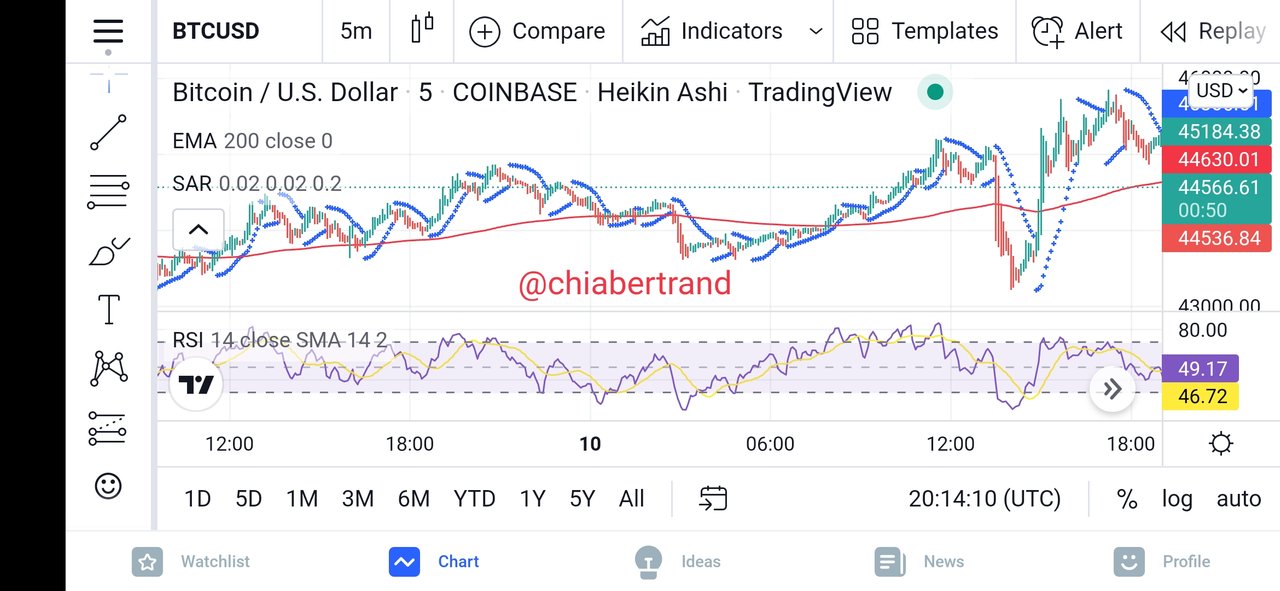
Performing A Sell Short Order Using This Strategy
Trade Entry: What is required here is simply to look for a good and perfect selling position where the EMA indicator is above the price level and then confirm it using the Parabolic Sar by making sure the dots of the indicator is above the price level. We further confirm this selling position by using the RSI indicator by making sure the indicator is above the 50 mark line or at mid band. Once all this criteria is met, we consider this selling position as our entry point
Trade Exit: This is living the market after we most have encountered some profits and what is required is to simply close the market by monitoring any trend reversal dots from the dots of the parabolic Sar by looking at a good support level in the market then use it as our stoploss by taking into account our risk management method
Screenshot taken from tradingview.com
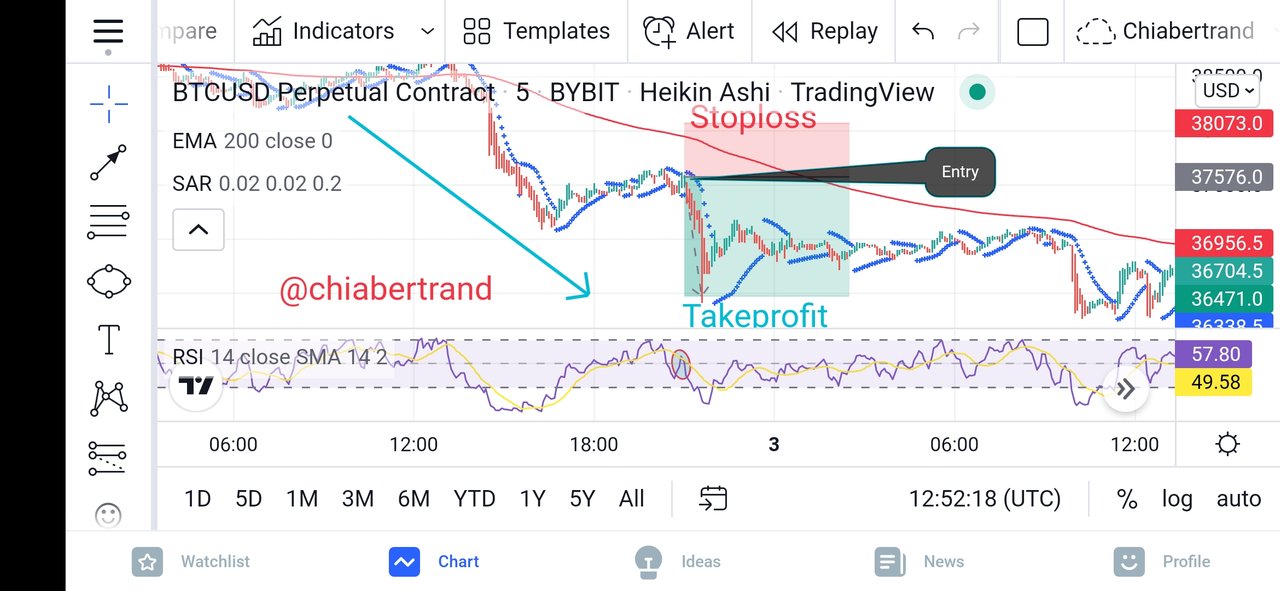
From the BTCUSD chart above, we see clearly that we have been able to identify a good sell short position because the price of the BTCUSD is trading below 200 EMA telling us that it is bearish. We can also see how the dots from the parabolic Sar is trading above the BTCUSD price by telling us that it's a good point for selling signals. The RSI indicator was found above the 50 mark by futher telling us that it's a good position to enter our sell short order
I then exit the trade by placing my stoploss above the dots of the parabolic Sar and the EMA 200 with a takeprofit taken when we see the price appears above the dots of the parabolic Sar then making our proper risk management method
6- Do a better Technical Analysis considering the above-explained trading strategy and make a real buy long or sell short position at a suitable entry point in any desired exchange platform. Then close that buy or sell position after appearing trend reversal signal from the Parabolic SAR indicator. Here you can also close your Buy or Sell position using any other desired Trading Method in addition to the signal coming from the Parabolic SAR indicator. However, here you must prove that trading method as a reason for closing your position. (Usually, You should demonstrate all the relevant details including entry point, exit point, resistance lines, support lines or any other trading pattern. Use at least 2X leverage and no more than 10X )
I'm going to be carrying out a technical analysis using the pair of ADAUSDT in tradingview.com then go and Perform my buy long order in my verified Binance account
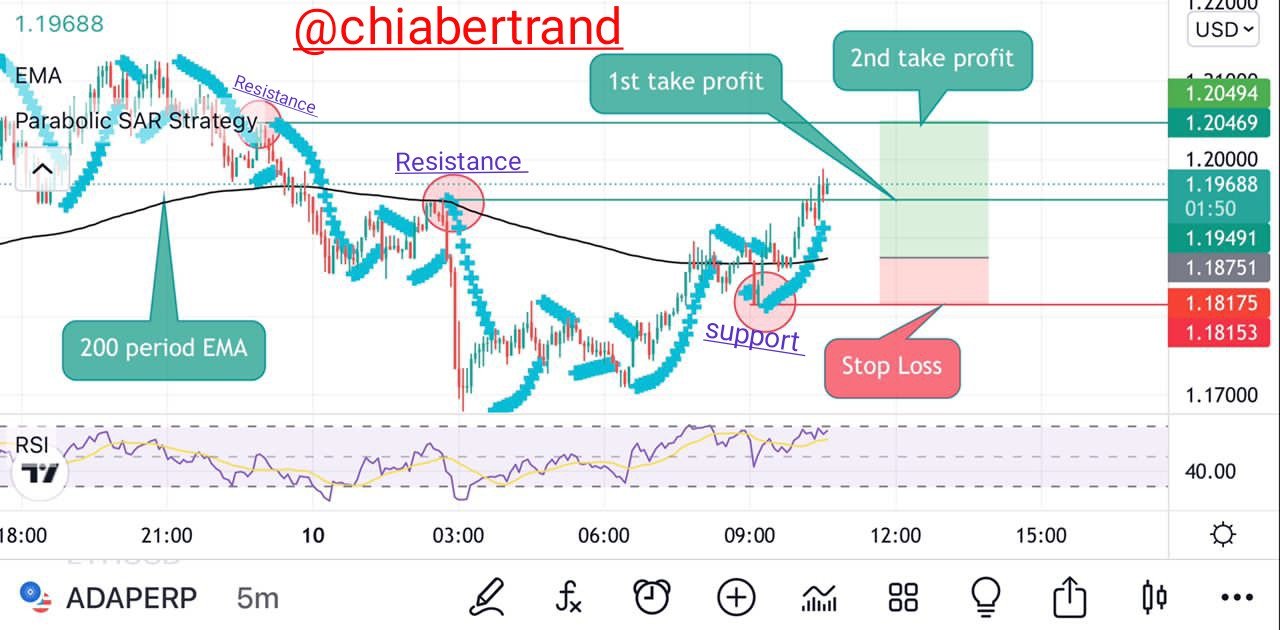
From the ADAUSDT chart below, I saw clearly that I was able to identify a good buy long position because the price of the ADAUSDT was trading above 200 EMA telling me that it was a bullish trend. I confirmed this movement from the dots of the parabolic Sar because it was trading below the ADAUSDT price by telling me that it's a good point for buying signals. The RSI indicator was found below the 50 mark by futher telling me that it's a good position to enter my buy order trade.
Screenshot taken from tradingview.com
I then had to identify both support and resistance points and used then as my takeprofit and stoploss when I finally received signals of buy entry directly from the parabolic Sar
Screenshot from Binance
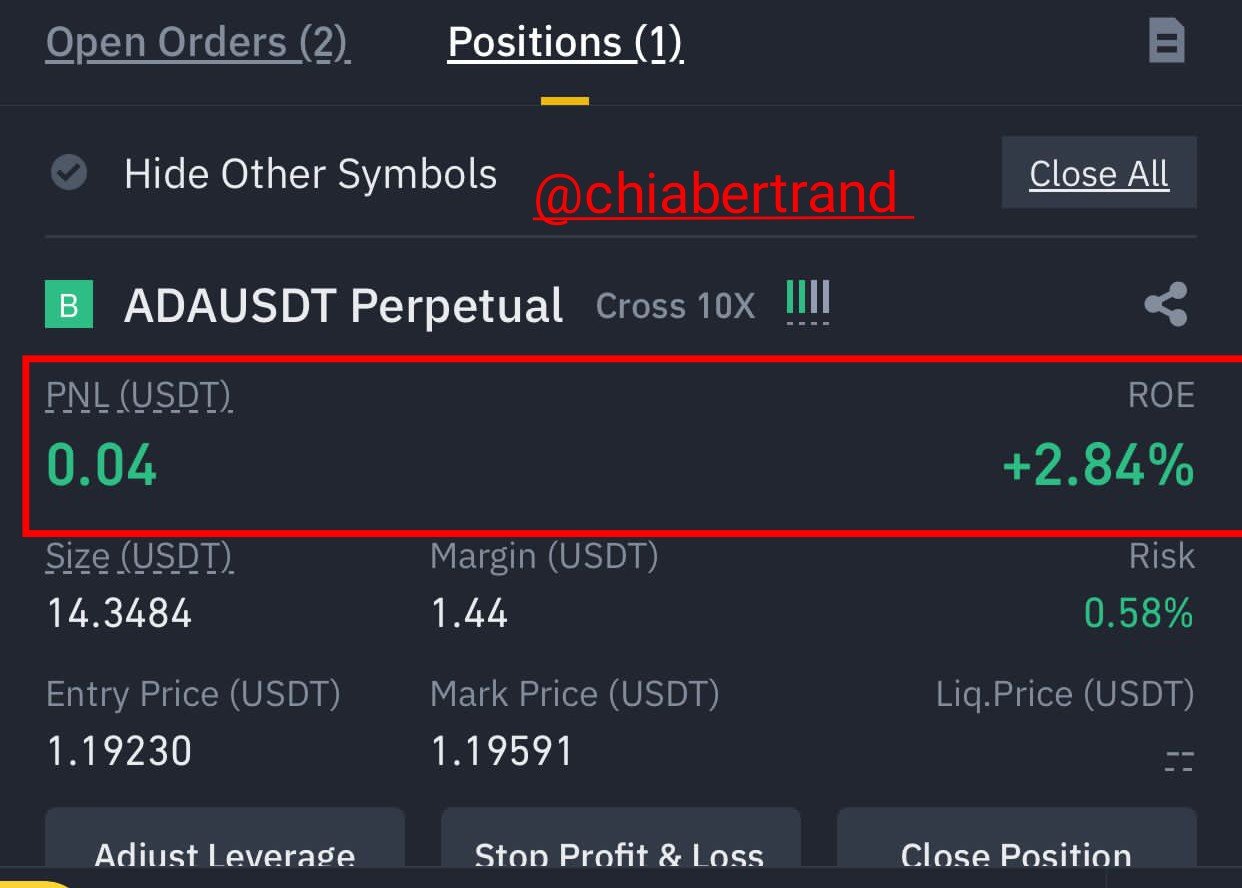
I had to place a real buy long trade order from my verified Binance account with an initial capital of $15. I had to multiply it 2x for the buy entry. When I multiplied it, I discovered that I had a total buying power of $30
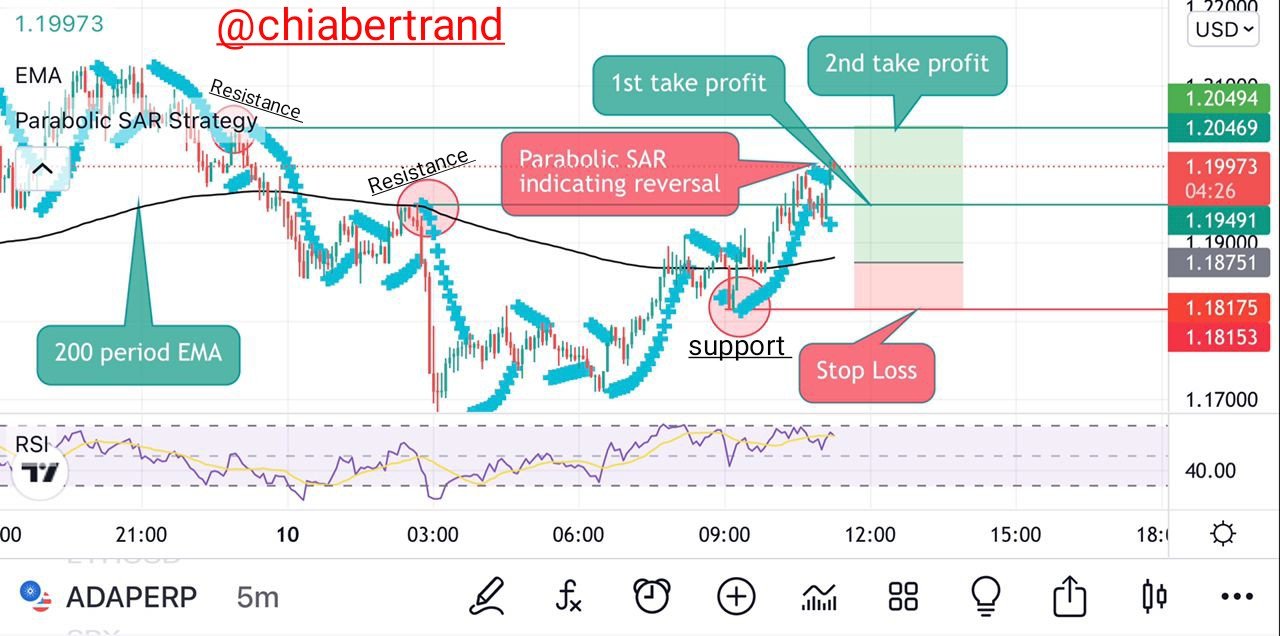
I waited patiently for about 2 hours when I had started to experience an amount of profit then started realizing the Parabolic Sar Indicator have started experiencing a trend reversal by starting to appear above the ADAUSDT price level.
Screenshot taken from tradingview.com
I still realize when my target had successfully been hitted at my position, I then had to close the trade going home with my Profit from my buy long order
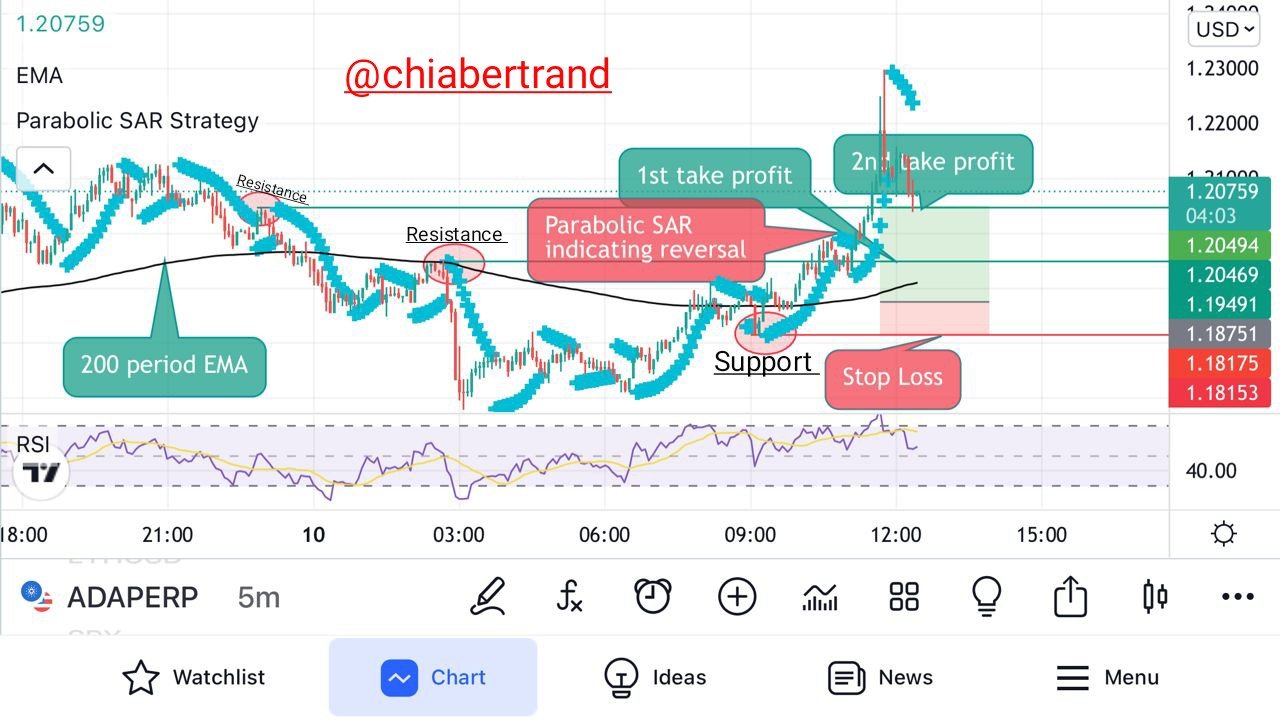
Screenshot taken from tradingview.com
The screenshot above shows that I have successfully hit my Target because the Parabolic Sar Indicated a price reversal pattern which I then had closed my trade and take home my Profit
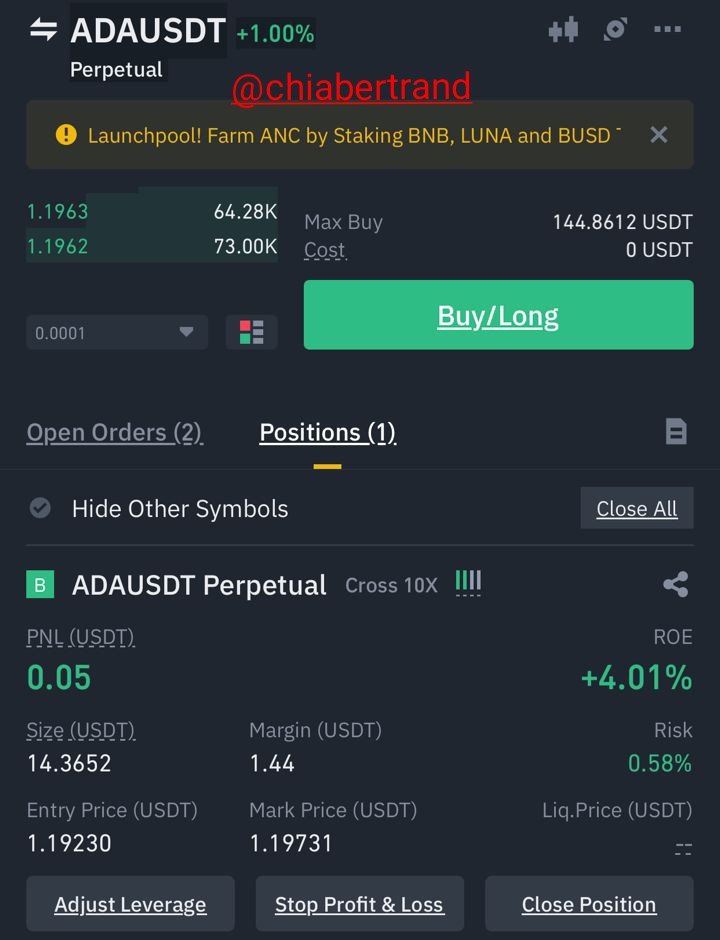
Screenshot from Binance
So far I have been able to know what is leverage trading and in my research, I discovered that it's a type of trading technic which usually enable traders to have a high power of purchasing a crypto asset in the market with just little capital. I have also been able to research and know the pros and cons of leverage trading.
We have also seen that Indicators such as RSI, EMA and parabolic Sar are good Indicators that we can use to carry out leverage trading because we can be able to use them to identify sell short and buy long positions in the market. I was able to use this Indicators to carry out real buy long and I was able to hit my target position.
Thanks so much Professor @reddileep for this wanderfull and beautiful lectures because I have been able to grabbed so much knowledge on Leverage with Derivatives Trading Using 5 Mins charts
CC
@reddileep