Introduction
It's another precious time to be writing at the Crypto Academy and I'm glad that I am doing that at the moment. Season 5 of the crypto academy has begun and has entered the second week. For this week, I will share yet another lecture with you which happens to be my first lecture of the season. I hope you'd have a nice time on this. Let's take a walk together.

Made in Adobe Illustrator and Photoshop
Background to the Study
Studying assets in the crypto ecosystem comes in numerous ways and the choice of any method solely depends on the user's comfortability or expertise. These studies are often regarded as analysis, as such, we have fundamental analysis and technical analysis. Whichever method is chosen for the analysis of a crypto asset comes with the aims of studying the behavior of the asset before going into its market, in other words, before investing in the crypto asset under study.
For technical analysis, we have several technical indicators that can be installed on the cryptocurrency chart to measure the price behavior of an asset at a certain period. Many of these indicators are capable of revealing the price histories of assets at a certain time as desired by the user and can be used to predict the future price behavior of an asset based on the result of the analysis. Today, we would be talking about a technical indicator known as Aroon Indicator. Without any further delay, let's get into the context proper.
Aroon Indicator
Aroon indicator is an invention of Tushar Chande which was developed in the year 1995. Aroon indicator identifies the existence of a trend, identifies probable trend change, and measures the strength of the trend. This is a great technical indicator for trend traders as it can be easily used the monitor the trend behavior of the asset under study at a certain period and this would enable to gain insight into the market of such an asset before choosing their entry/exit positions in a trade.
Most versions of the Aroon indicator is composed of two lines (Aroon-Up and Aroon-Down) which identify trends and indicate the strength of the trend in either direction (Uptrend or Downtrend) on a scale of 0 - 100, nevertheless, there are versions of the Aroon indicator which comes with a single oscillating line which identifies trend and measures trend strength with a line on a scale of (100 and -100). No doubt, this indicator is a potent one for trend traders, you will get to know more as we progress in the lecture.
Highlights of Aroon Indicator
- Aroon indicator identifies the existence of a trend in either direction (Uptrend/Downtrend).
- It identifies trend change at a certain period.
- It measures the strength of the trend in either trend directions (Uptrend/Downtrend), majorly, on a scale of 0 - 100.
- It consists of Aroon-Up and Aroon-Down lines.
How to Add Aroon Indicator to the Chart
- Visit https://www.tradingview.com/chart/ to access the chart of any asset of choice.
- From the chart's landing page, select fx at the top of the page in the quest to add an indicator.
- Search for Aroon and click one of the results. See the screenshots below
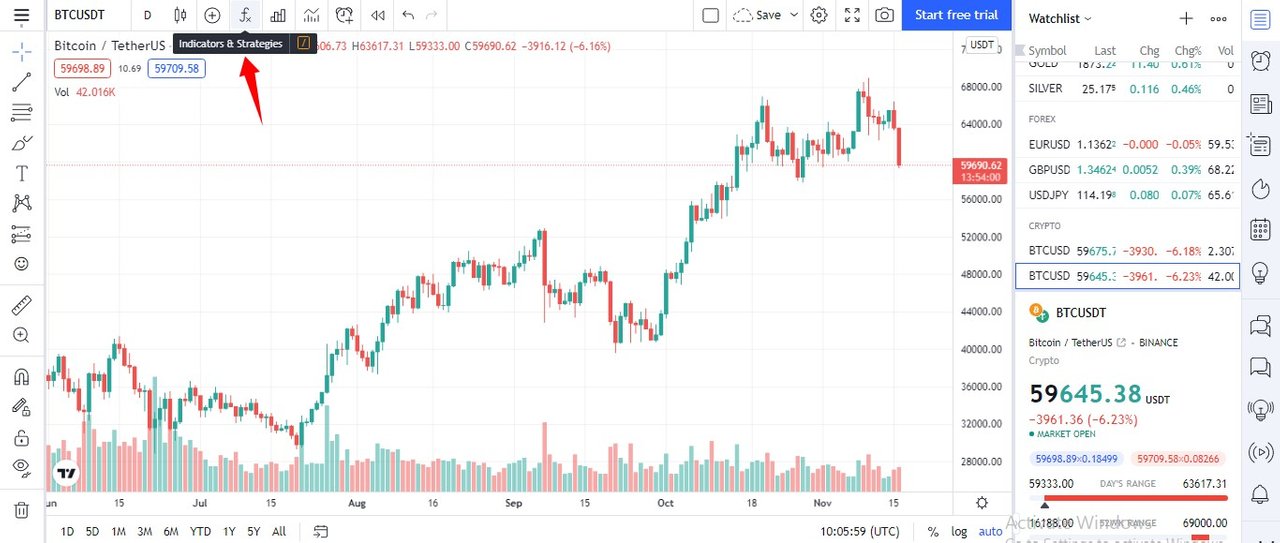
TradingView Landing Page- Select fx
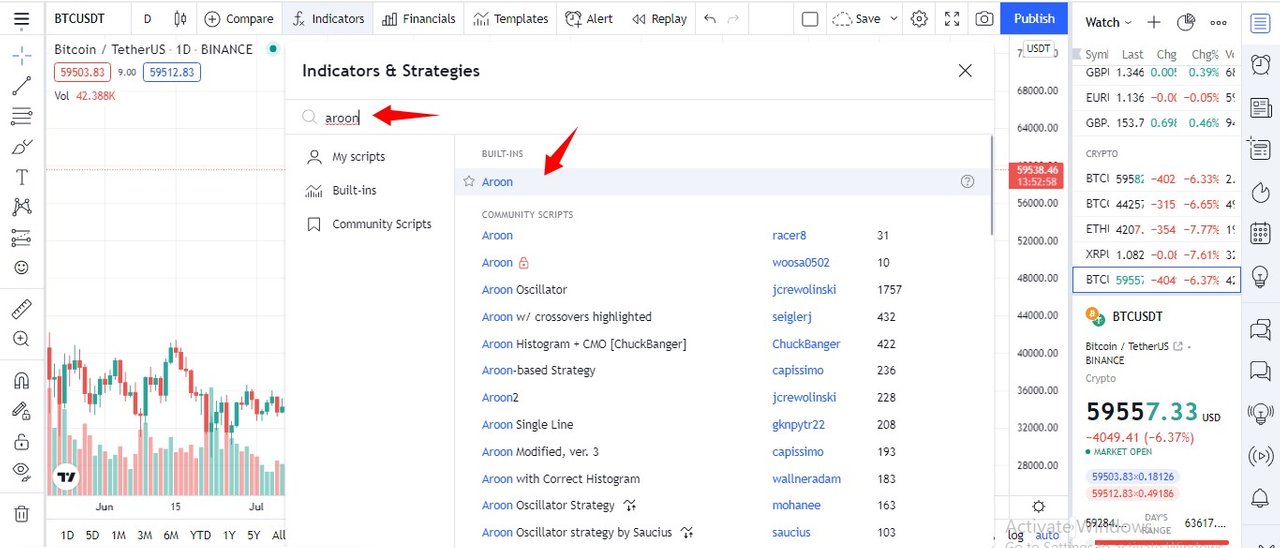
Search for Aroon
- Aroon indicator is mostly used at 25 periods settings. Click on settings and edit the period under inputs. For styles, you can use any color of choice for Aroon-Up and Aroon-Down.
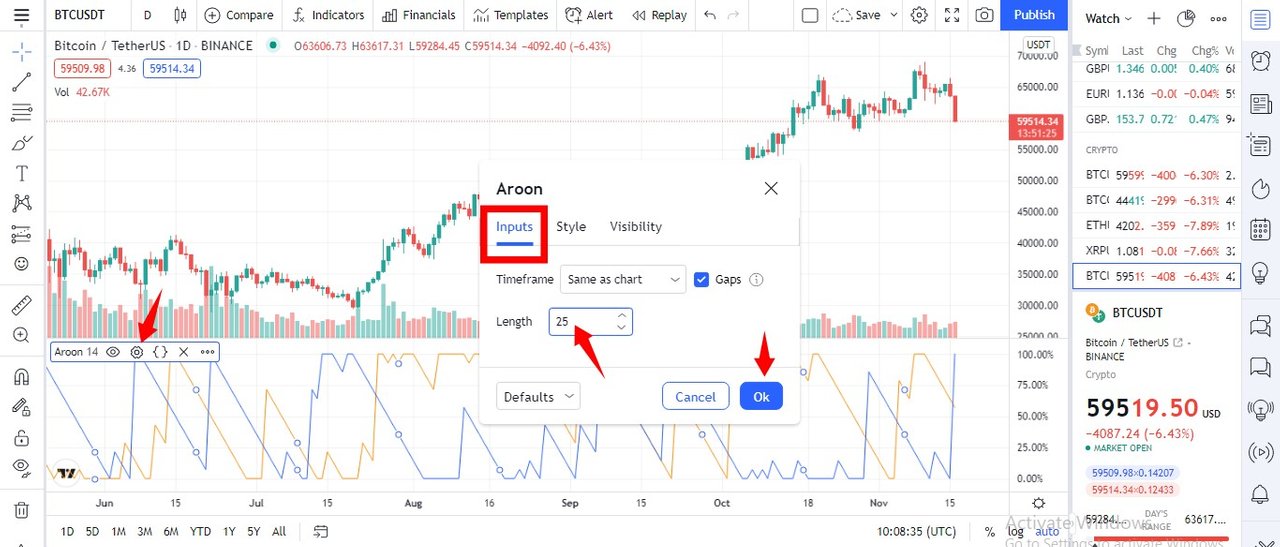
Inputs
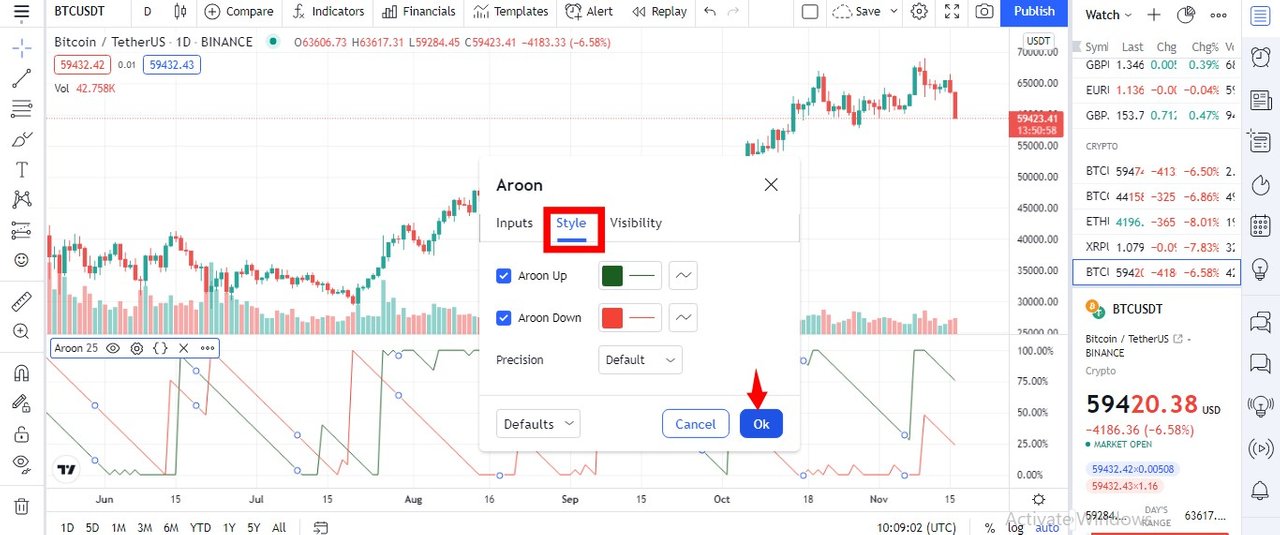
Style
- Now that you have set the indicator to preference, effect the change by clicking the OK button and we have the indicator fully set up on the chart.
Aroon Indicator
Aroon-Up
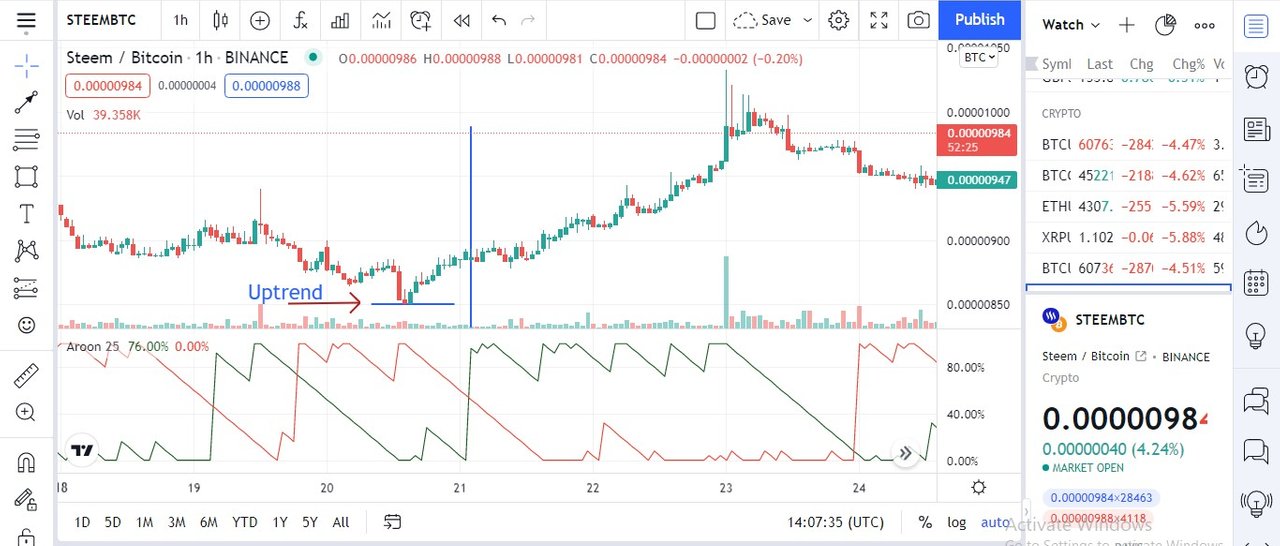
This is one of the Aroon indicator's lines that measures the uptrend price movement of an asset and indicates the strength on a scale of 0 - 100. I call this line a Positive Aroon Line because of its upward trend's strength indication.
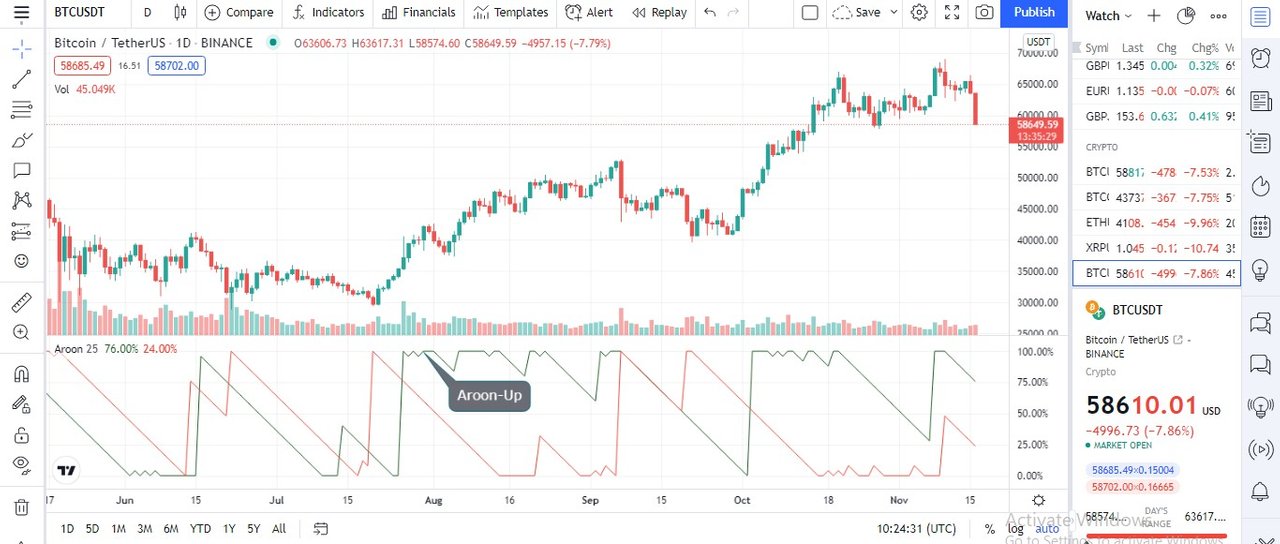
Aroon-Up
From the chart above, you can see where the green line is above the other line and moving in the upward direction which indicates the uptrend.
Aroon-Down
The second line of the indicator is Aroon-Down which indicates the downward movement of the price of an asset and I call this Negative Aroon Line and it also measures the strength of the downtrend on a scale of 0 - 100.
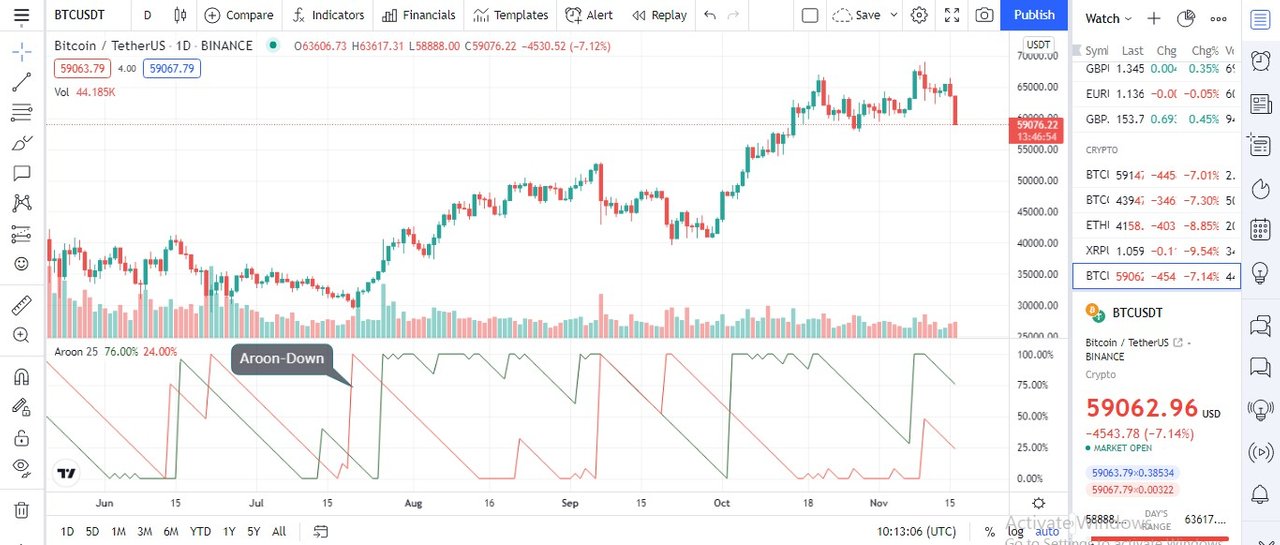
Aroon-Down
Likewise, from the screenshot above, the Aroon-Down indicator's line with the red color moves below the Aroon-Up as indicated and this shows that the price of the asset moves in a downtrend, and the strength of the downward movement is measured by the line.
Formula for Calculating Aroon-Up and Aroon-Down
For Period = 25;
- Aroon-Up = ((25 - Number of Periods Since the Recent 25 Period High)/25) X 100.
- Aroon-Down = ((25 - Number of Periods Since the Recent 25 Period Low)/25) X 100.
The value of Aroon between the range 70 - 100 is an indication of a strong trend, likewise, the value of Aroon between the range 30 - 0 (30 and below) is an indication of a weak trend. It's proved that a strong trend indication given by the Aroon indicator through the lines (Aroon-Up/Aroon-Down) is accompanied with Higher highs and lower lows. Note that, when the indicator stays long around 100, that could be a sign of a probable trend change in sight and traders should be on the lookout.
Aroon Indicator Crossovers
Aroon Indicator with two lines (Aroon-Up and Aroon-Down) is associated with crossovers and as such, these crossovers open buy/sell opportunities for trend traders. Not only that buy/sell signals are the indications of Aroon indicator crossovers but it also indicates the authenticity of change in trend/beginning of another trend. Let's see the two different types of Aroon's crossovers.
Buy Signal
In a situation whereby the Aroon-Down movement has been above Aroon-Up for a certain period, if at a point the Aroon-Up changed direction and moved up to cross over Aroon-Down, this implies a change of trend, and opens a buy position for traders using the indicator.
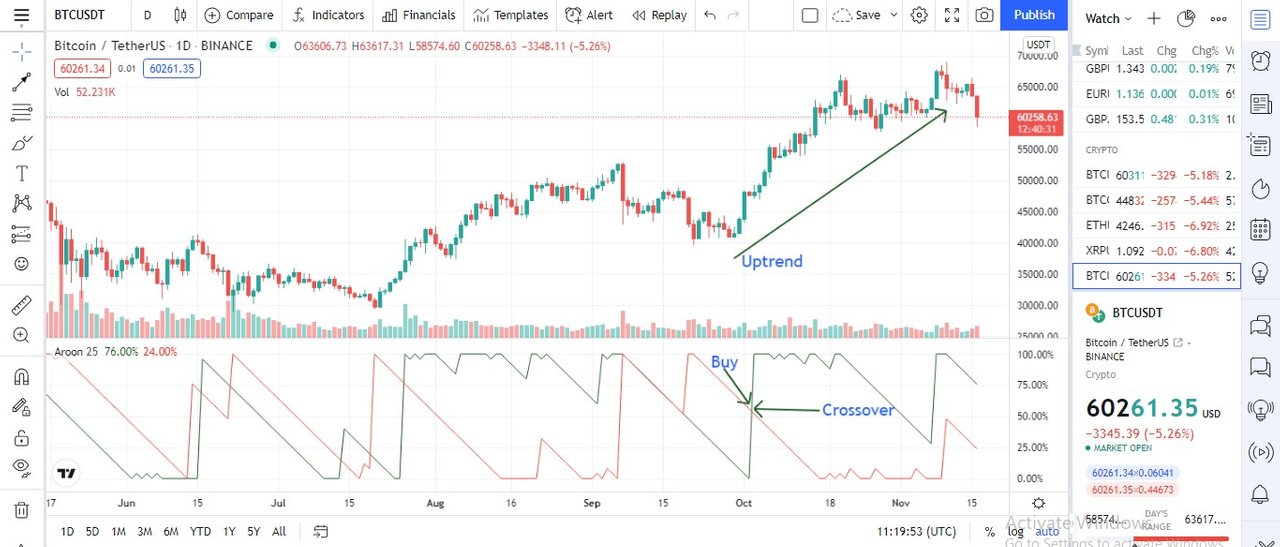
Aroon-Up Crossover
From the chart above, the Aroon-Up has been moving below the Aroon-Down for some time until it changed direction. The Aroon-Up moved and crosses above Aroon-Down which opens a buy opportunity, the buy signal given by this indicator is valid as the line moved towards 100 and stayed at 100 for some time, which implies a strong trend and that can be seen as the price of the asset greatly moved uptrend.
Sell Signal
The Aroon indicator is also capable of giving sell signals and this happens when the Aroon-Down has been below Aroon-Up for some time which means the asset has been in an uptrend. At a point when the Aroon-Down changed direction to move up and crosses over Aroon-Up signals a change of trend, and also opens a selling opportunity. Let's see a chart below.
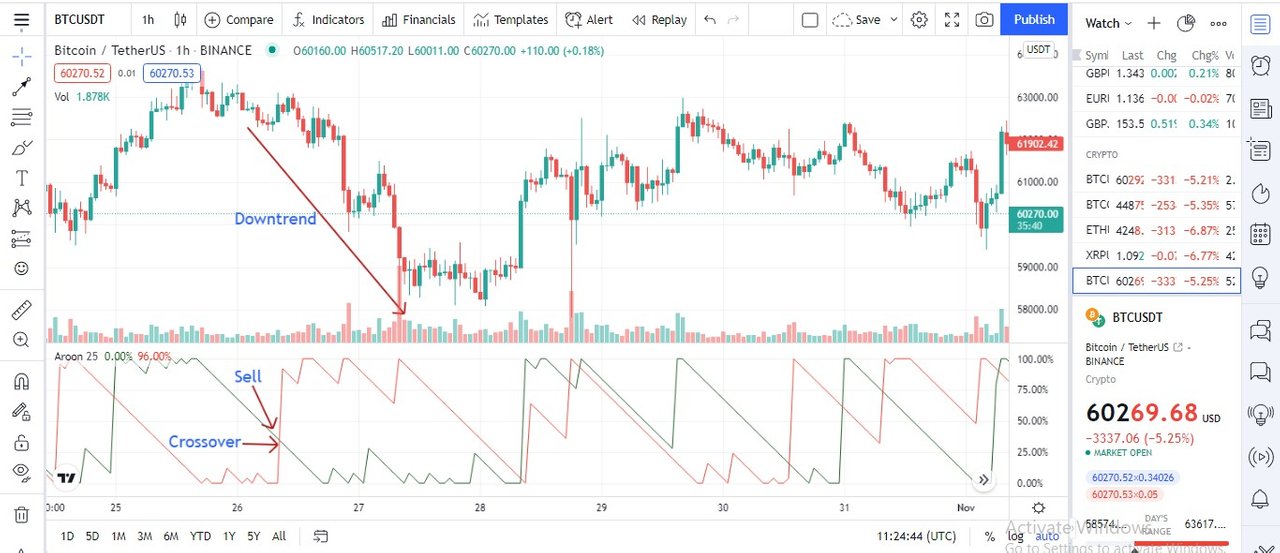
Aroon-Down Crossover
From the chart above, in an existing uptrend of an asset, the Aroon-Down moved up and crosses over Aroon-Up. The result of the crossing over is that the price of the asset moved downtrend which gives a valid sell signal. The line moved up towards 100 which indicates a strong downtrend and a lower low was seen on the chart. A trader would have entered the market with the selling opportunity given by the Aroon indicator and with proper trade management, the trader must have gotten something.
Aroon Indicator Range Movement
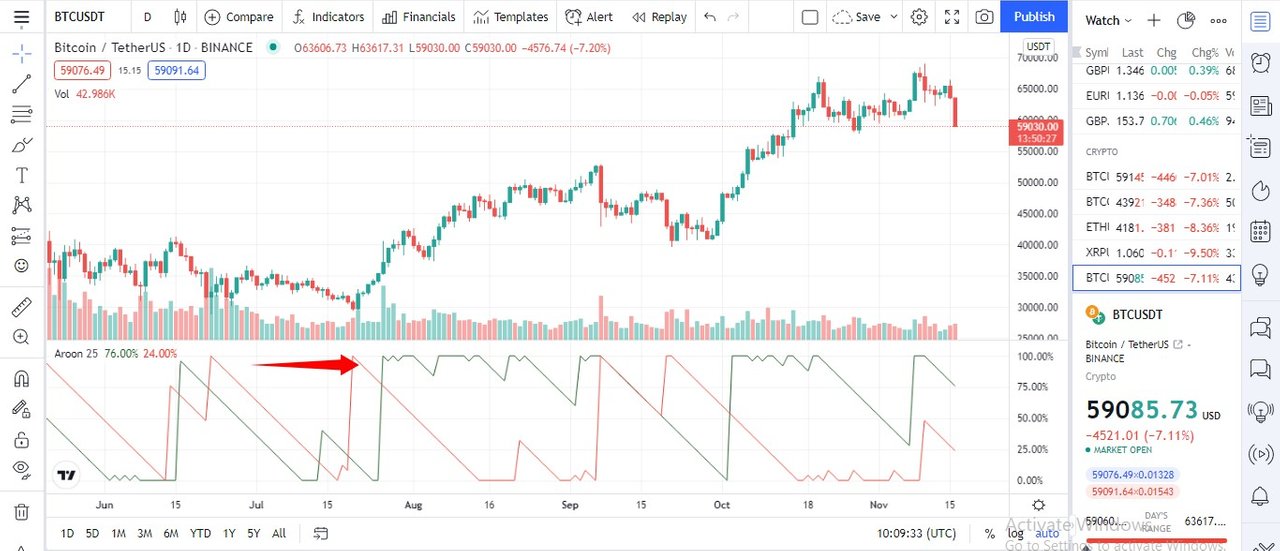
We have highlighted how the Aroon Indicator identifies the trend, the change of trend, and how it measures the strength of trend through the movement of the Aroon lines (Aroon-Up and Aroon-Down). In addition to the above-listed usefulness of the indicator, it also identifies a ranging market/sideways movement where there is no trend, and this helps trend traders to be on the lookout for when there would be a trend before making investment decisions. In this case, the Aroon-Up and Aroon-Down would be seen moving in parallel or have a sloppy movement to each other without crossovers for a certain period.
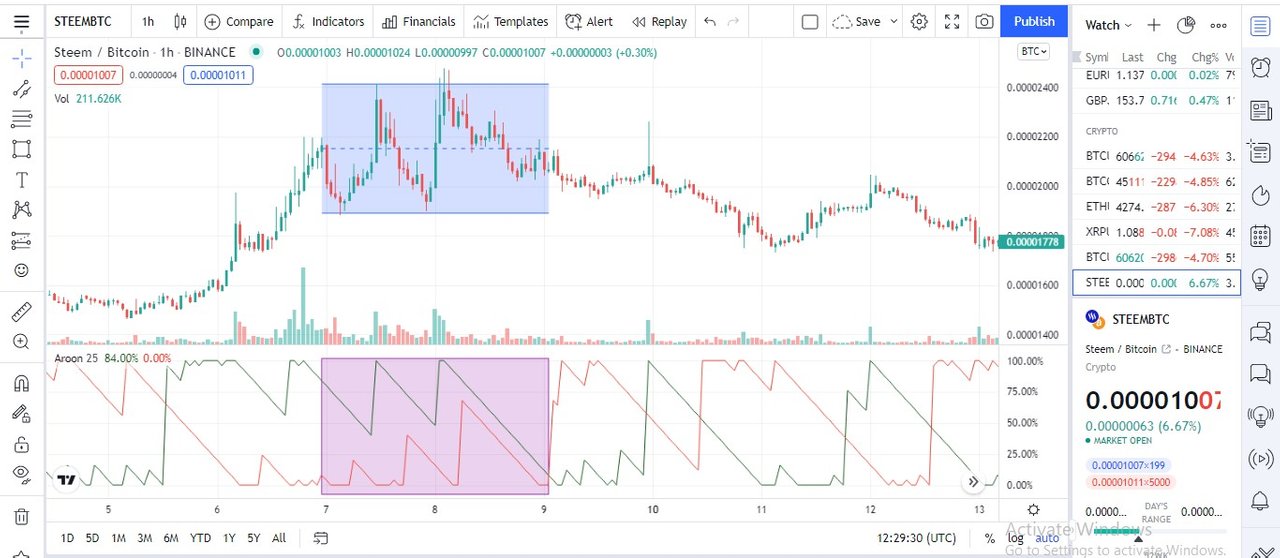
From the chart above, the Aroon-Up has been above Aroon-Down for some time which implies the price of the asset has been in an uptrend. There are several moves of Aroon-Up and Aroon-Down heading up/down as if there would be a crossover but returned to the previous positions at almost the same levels which indicates that the market is consolidating, and this can be seen on the chart of the asset. If the indicator moves this way, you should know that it's a ranging market. The movement persist for some time before a crossover exist. .
Aroon Indicator Late/False Signals
Like every other technical indicator, Aroon Indicator also gives false signals. One of the reasons for such an occurrence is that it's a lagging indicator which only considers the past price behaviors of assets, in that case, the movement/crossovers of the indicator's lines can occur late and the real action might have taken place before the indicator gives its signal. And in range markets, there could be an occurrence of multiple crossovers which results in false signals as the movements don't last.
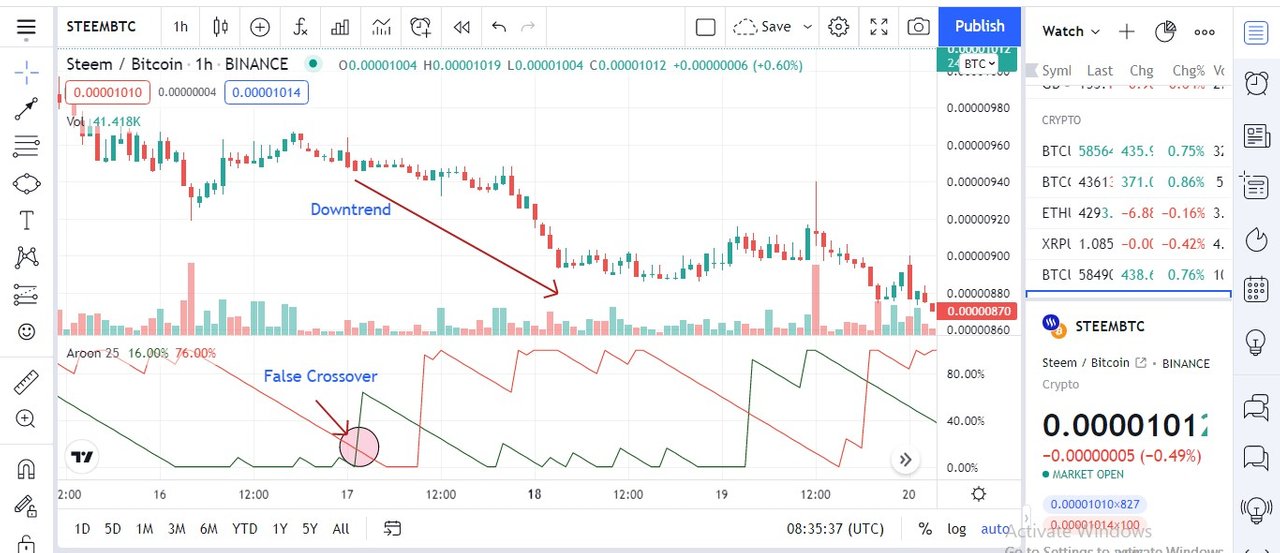
Above is the chart of an asset where the Aroon-Up crossed above Aroon-Down which could have been interpreted as a buy signal but in the real sense, the market continued in downtrend. The Aroon-Up continued its movement until it hit around 64 before it moved downward to cross below Aroon-Down. Proper caution must be taken when using this indicator to avoid such occurrence of false signals has indicated above.
And from the chart above, the level where the uptrend began was marked, likewise, where the crossover took place. It is evident that there have been several uptrend candlesticks that confirmed an uptrend before the crossing over occurred, as such, a late signal was given.
Relative Strength Index (RSI) combined with Aroon Indicator to Detect Early Trend Change
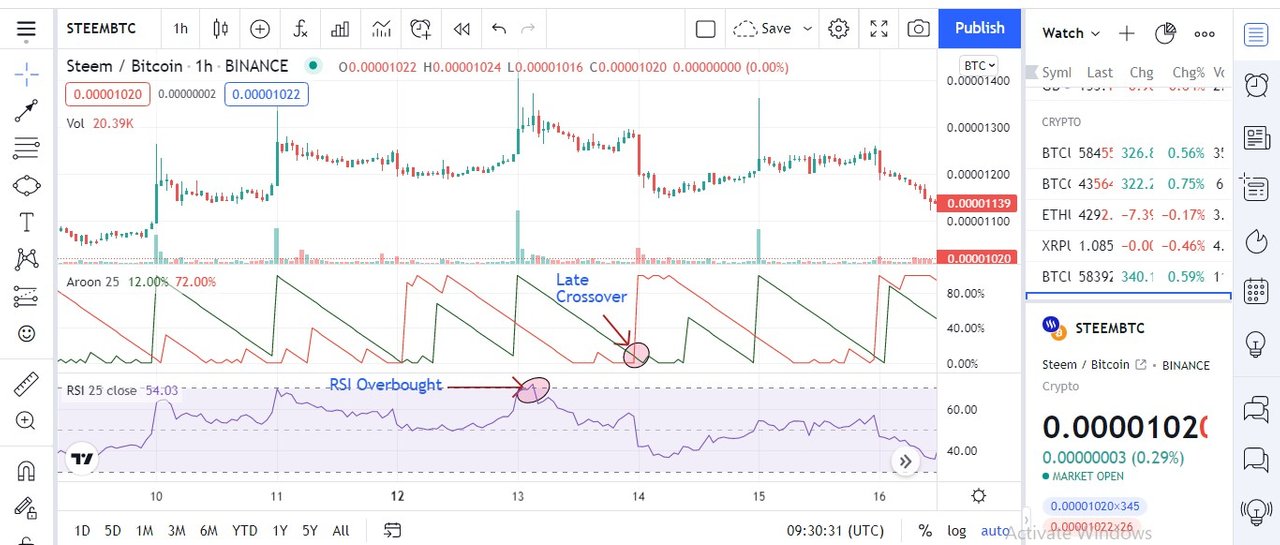
The RSI indicator can be used to confirm early trend reversals before it became evident using the Aroon indicator. In the screenshot above, RSI was combined with the Aroon indicator, and when the RSI oscillating line hits slightly above 70 that is an indication of overbought which is associated with a trend reversal. A trend reversal occured as the asset's price was reversed and moved downtrend, giving the trader an early insight into the new trend ahead, the Aroon-Down lately confirmed the move, the asset has been in downtrend for sometime before Aroon-Down picked its race . RSI is one of the technical indicators that can be used in combination with the Aroon indicator for better output.
Conclusion
In conclusion, the Aroon indicator is one of the technical tools that are effective and easy to use. Aroon enables traders to identify the existence of a trend, change of trend, and it as well measure the strength of the trend in either direction (Uptrend/Downtrend). One of its demerits is being a lagging indicator which makes it not suitable for predicting the future price of an asset. To filter false signals and avoid late signals from crossovers, the indicator must be used with other technical indicators. This is all we have for today and I hope you had a good read through this lecture. Thank you.
Homework Task
- What is Aroon Indicator in your own words? What are Aroon-Up and Aroon-Down? (Show them on Chart).
- How is Aroon-Up/Aroon-Down calculated? (Give an illustrative example).
- Show the Steps involved in the Setting Up Aroon indicator on the chart and show different settings. (Screenshots required).
- What is your understanding of the Aroon Oscillator? How does it work? (Show it on the chart, kindly skip the steps involved in adding it).
- Consider an Aroon Indicator with a single oscillating line, what does the measurement of the trend at +50 and -50 signify?
- Explain Aroon Indicator movement in Range Markets. (Screenshot required).
- Does Aroon Indicator give False and Late signals? Explain. Show false and late signals of the Aroon Indicator on the chart. Combine an indicator (other than RSI) with the Aroon indicator to filter late and false signals. (Screenshots required).
- Place at least one buy and sell trade using the Aroon Indicator with the help of the indicator combined in (7) above. Use a demo account with proper trade management. (Screenshots required).
- State the Merits and Demerits of Aroon Indicator.