

Hello All,
My self @stream4u, I am from India and one of your crypto professors, welcome you all to my class.
This is my fifth lecture on Technical study. In this course, we will learn another strong Indicator which is SuperTrend, in this, we will see how SuperTrend can help us in trading and investment, how it shows signals for Sell and Buy accordingly what will be the safer side to buy. To cover this indicator, I have taken TradingView Topic in the last course so that everyone will know basic about TradiingView platform and by Homework, you will get some hands-on experience. Because I am not sure if SuperTrend Indicator will be available on your trading chart platform.
It's a humble request to all interested, first understand the course then please read the homework task 2-3 times, make a homework task that includes all requested topics, and before publish make sure all topics are covered. Give your best to explore it as much as possible and in simple terms.
For your future, try for the information, charts, graphs available in your post is not taken from other sources and it is your own.
Let's begin our 5th class.
First, let me tell you why it is important to learn about SuperTrend Indicator & Why I have selected this topic?
So, we have learned Support & Resistance, how Support Become Resistance and Resistance Become Support, Double Top, Double Bottom, Higher High - Lower Low, 200 MA, according to these all how to place the orders.
Now suppose when you see any assets and you noticed that their buying level/signal is already gone, now it is going up and you missed that chance, here our rule says Never Enter In A Running Market & Work With Patience. that is true. But now SuperTrend is one of the Indicators can actually help you in a Running market, just need small patience if you use it in my way.
About SuperTrend.
SuperTrend Indicator is one of the very simplest indicators but having is a good success rate. This indicator can be used in a day trading like Intraday or we can also use it for the long term, we just need to adjust the candle chart time frame according to our trade like 5 to 15 minutes for Intraday and 1 day for the long term.
According to the chart time you have set, the SuperTrend will give you the Buy and Sell signals. As we know there is nothing 100 accuracies in Indicator and sometimes they give false signals so it is applicable for SuperTrend Also, but there are very less chances that SuperTrend gives false signals.
SuperTrend is a simple line that follows the price, the SuperTrend line can be seen above the current price OR below. When it is above that means it's indicated the Sell-side, and when it is below that means it has indicated for the Buy-side. Take a look at the below image.

Now, there are many opinions, information, tricks you can find that available on the Internet, however, in the end, they are the same and nothing is 100%, but as per my personal experience, I can show you how we can use Supertrend and its signals, and how safely we can trade on it to secure our Capital.
How To Use SuperTrend Indicator?
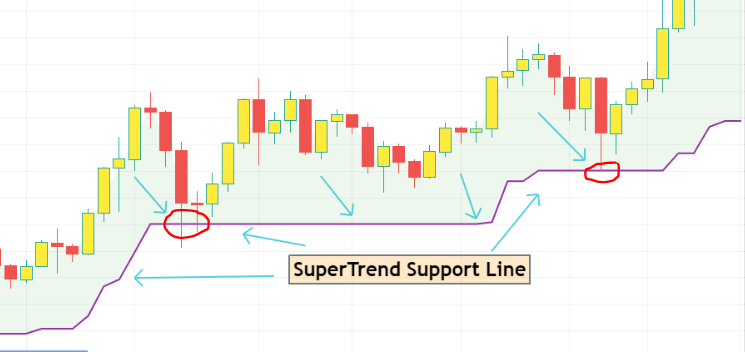
According to the above image and as I said when SuperTrend Line is below the current price, then wait till the price comes down to near the SuperTrend line, you can place the buy side somewhere near to that line. SuperTrend line has strong support and it has the capacity to take the price back to the previous high in a short time.
We can see how the price action respected to the SuperTrend Support Line and then went upside.
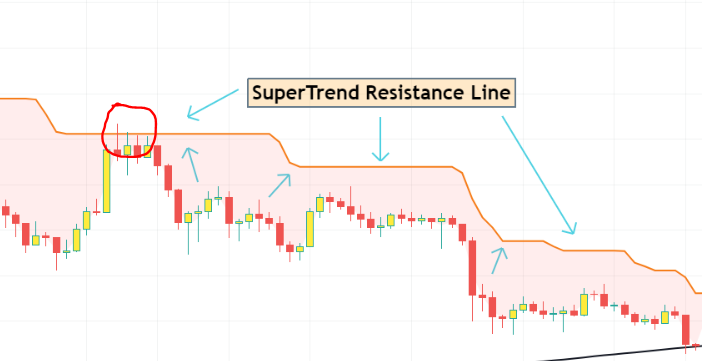
According to the above image, we can see how price touches the SuperTrend Resistance Line and then came down. So when you have already bought somewhere at a low point OR you want to go for a fresh Sell trade, a buyer can think to exit when it is touching to the SuperTrend Resistance Line and here Seller can take their fresh sell entry.
Let's See SuperTrend Indicator On 1-Day Candle Chart.
You all know that the big fall in Crypto on 11th January 2021, if not then you can check now on the chart with 1 Day candle. On this day Bitcoin, Ethereum, and major assets fall badly in just one day. I was pretty sure that many have a square of their position who entered in a bull running market when BTC, ETH, and other assets running up fast and they square off the position either in loss or with a small profit, but in next few days the price was back on last high and went more up, now everyone like us thinks why I did square off.
We see many times that even after assets fall badly, sometimes they cover in few days and come back to the last high point.
Now I will show you two same charts but one is without SuperTrend and another one is with SuperTrend, you can find the difference and as I mentioned above how to use it, according to that you will see now how it is helpful. (This is a chart for 11th January 2021 hence concentrate on that day candle only.)
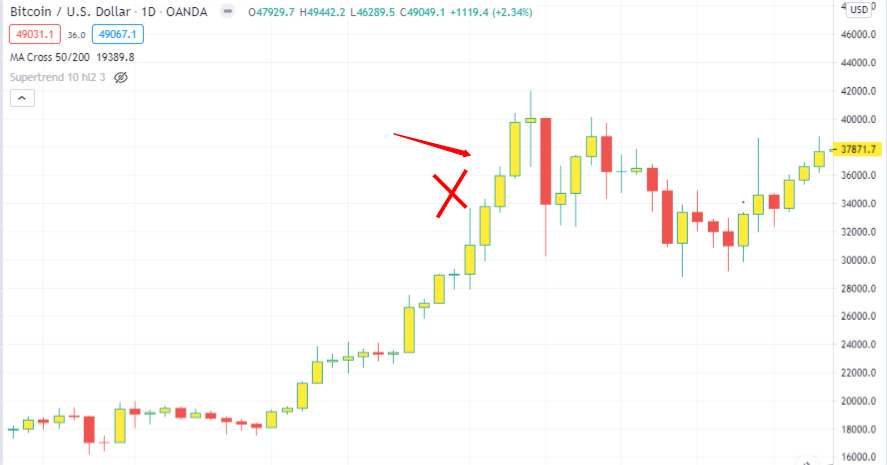
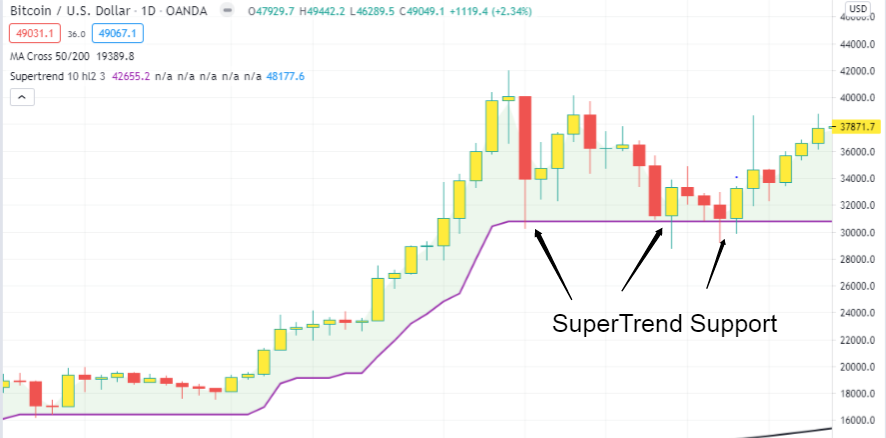
From the above two images, you will see what I am trying to show. Instead of entering a running market with a lot of pressure in mind, also when no chart pattern to help how SuperTrend can give you an accurate support line where you can think for a buy. Now see what happened next after this(considering the second image with SuperTrend).

The SuperTrend Support level showed at near $31000, now the current price is near $50000 and already high point made at $57000.
It's difficult to show all examples but similar to the BTC example you can find the same pattern of SuperTrend in Ethereum and many other assets for that same day.
False Indications.
As I mentioned, like other indicators there are possible chances for false signals in SuperTrend too. Now will see how false indication looks in SuperTrend Indicator what we can do in such a scenario.
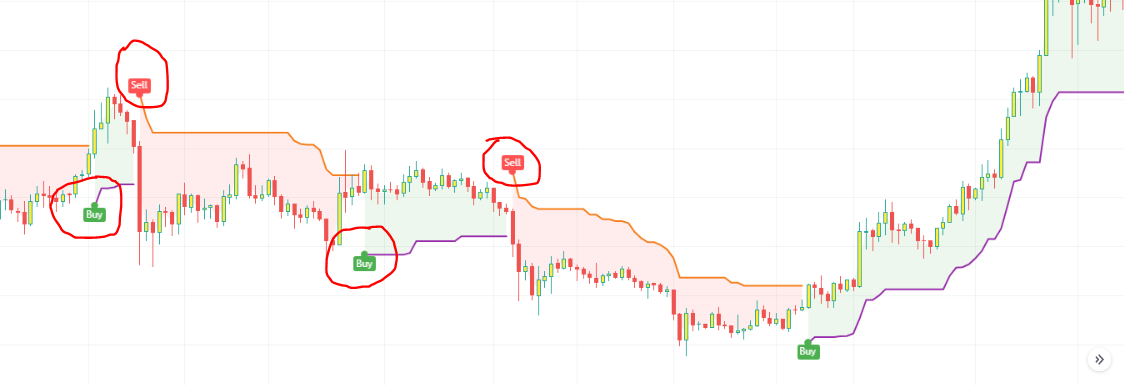
In this image, we can see after the indication of buy how quickly it indicated about Sell, then next again happen same. So in such a scenario, don't get panic.
Because of such a scenario, I have suggested taking a buy or sell trade or square off the position when the price touches its support or resistance. Don't take trade immediately when it indicates buy and sell, wait & watch till the price comes to its support or resistance when it comes then go for your trade.
STOPLOSS.
We will set Stoploss in SuperTrend based on the last Support as we have learned how to find the last 2 supports.
If you have taken buy trade, sometimes SuperTrend break and indicate Sell signal, do not consider that as we learn Support and based on that how to find last 2 lows to set stop loss, in SuperTrend you will need to do same, do not go with the sell signal and instead of that find last 2 lows for Stoploss.
There is some fluctuation possible when SuperTrend shows a Sell signal but still, it is near to its support hence major chances that even it shows a sell signal many times prices went up in some time.
You can add SuperTrend Indicator on your TradingView chart, and below are its settings, in Style so that you can set as you want.

We will stop here and Thank You for attending this course. If it possible for you then I would like to know your view on this course in the comment section.
There are still many things that we will be going to cover in the next upcoming topics wherein we learn Large Capital - Mid Capital - Small Capital., Money & Portfolio Management..
| You have any topic regarding the technical concept and the market in which you are getting difficult for understanding, so feel free and you can share that with me in the comment section and I will surely give my views on it through next courses. |
If you have any concerns, doubts, questions on this topic, you can ask me in the comment section and I will try my best to address them.
If you like to give me any feedback then that also you can give it from the comment section and I will surely review it and see the possibility to work on it from the next course.
HomeWork Task 5
Make a Homework Task 5 Post on the below Topics.
- What Is A SuperTrend Indicator?
- Show how to set SuperTrend on Chart and what are its settings need to configure.(Screenshot Needed)
- How SuperTrend Shows Buy-Sell Indications? (Screenshot Needed)
- When We can place a Buy Trade with the help of SuperTrend Indicator? (Screenshot Needed)
- When we can place exit/square off, sell order with the help of SuperTrend Indicator? (Screenshot Needed)
- How false indications look in SuperTrend Indicator? (Screenshot Needed)
- According to your view what Stoploss you will suggest?
- Conclusion.
RULES
IMPORTANT:- All homework posts should be posted in the community Steemit Crypto Academy .
For Homework Task 5, add tag #supercrypto, #stream4u-week5 in the first 2 tags. Also, tag me as @stream4u somewhere in a post. (still, peoples are tagging incorrectly due to which posts are getting missed from review.)
PLAGIARISM Will Not Accepted, hence make sure content in the post not copied and pasted from certain sources.
Submit Homework Task Post from 8th March 2021 To 14th March 2021.
Post Require a minimum of 300 words. Tips On a minimum of 300 words!
All screenshots of the Candlestick Charts should be taken on your own. You will get an extra Grade if you explore homework task as much as possible with your own words, the screenshot is from your own chart, properly defined pattern, and images not from a Google.
The post which has all mentioned topics will be considered as Completed.
(For any concerns, doubts, questions on homework task, you can ask me in the comment section below.)
Thank You.
@stream4u
Crypto Professors : Steemit Crypto Academy