Heading - Trading Strategy for Head and Shoulders and Inverted Head and Shoulders Pattern.
Hello steemians how are you? I hope you all are doing well and you all are safe and healthy during this pandemic time.
This is the first Homework task made by me as a professor in the steemitcryptoacademy and this homework is for the intermediate level students.


The very basic of technical analysis is trading with different market patterns. A market chart pattern is a structure that helps you to identify the future price movement in an asset's price.
There are many kinds of chart patterns some are used in volatile markets, some are used in a bearish market and some are used in bullish markets.
Mainly, there are two types of patterns, one kind of pattern tells about the trend reversals and another kind of pattern tells about the trend continuation.
Here, in this article, we will learn about some of the trend reversal patterns. Remember the most important thing is that, these patterns do not provide a 100% guarantee that the markets will go in the predicted direction but they gives indications of what might happen in the price of the asset when these structures are formed.
Let us talk about the trend reversal pattern: Head and Shoulders & Inverted Head and Shoulders Patterns.
Head and Shoulder Pattern
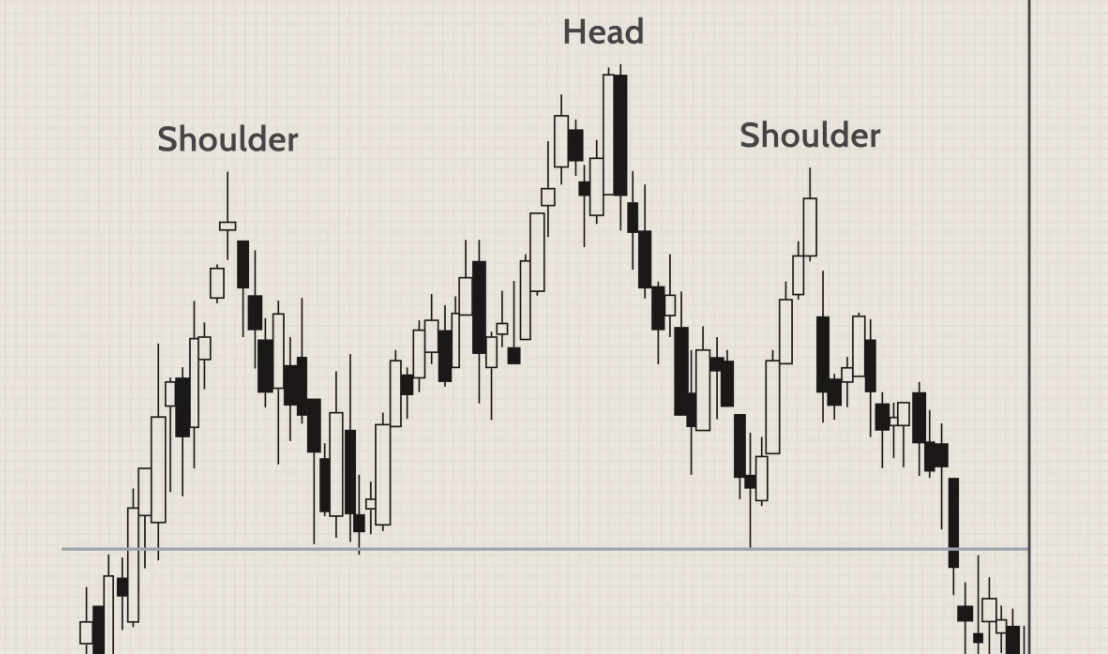
Head and Shoulders is a chart structure that has three peaks, out of these three peaks middle one is the highest peak and the other two are lower than the middle peak.
Head and Shoulders is a very basic candle structure of technical analysis, this structure formation predicts a bullish-to-bearish trend reversal.
The Head and Shoulders pattern is one of the most trusted trend reversal patterns. This pattern formation will predict that an upward trend is about to end and starting of a bearish trend has a high probability.
.png)
Formation of Head and Shoulders Pattern
The Head and Shoulders pattern has three basic components :
1. Left Shoulder: This is formed when price makes a peak in upward movement followed by a decline in price.
2. Head :After the formation of the left shoulder price again rises and makes a peak higher than the left shoulder's peak.
3. Right Shoulder : After the head peak is formed price again rises to make a peak of height lower than the head peak and similar to the left shoulder's peak.
The Head and Shoulders pattern is completed after the formation of these three peaks. This structure is very rare to be formed perfectly so there might be some noises in your shoulders peaks.
Trading with Head and Shoulder Pattern
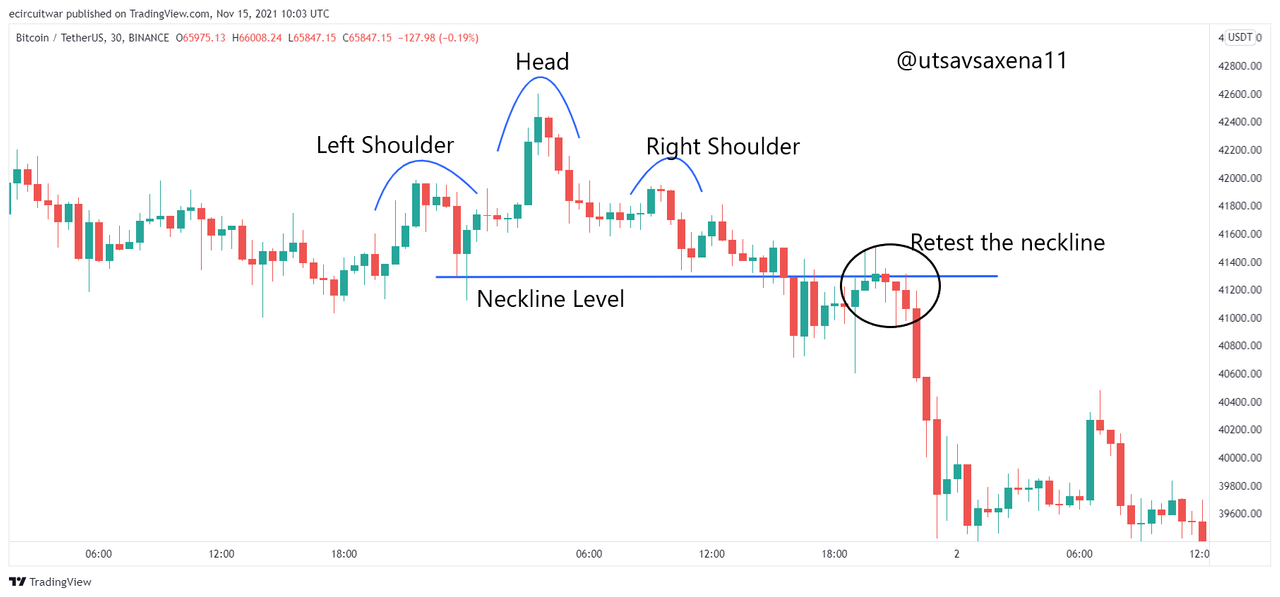
At first, you need to find the left shoulder, head, right shoulder in the chart. Once you find that complete structure, we draw a neckline.
Neckline should be drawn by joining lower ends of the head peak. In other words, the neckline is drawn by joining the low formed after the left shoulder and the low formed by the peak.
Once the trend line is drawn, we now wait for the price of asset to break the neckline levels. In the case of the Head and Shoulders pattern, the price of asset must break the neckline levels in a downward move by going below the neckline levels after the right shoulder is formed.
When these all points are fulfilled we can make a trade entry for a sell-side.
As we already discussed, the Head and Shoulders pattern is used for a sell-side trade, now we look at how to identify trade entry, exit, stop-loss levels.
.png)
Entry using Head and Shoulders pattern
To take entry using this pattern, first, the pattern should be completed. We take entry for a sell-side trade when we use Head and Shoulder Pattern.
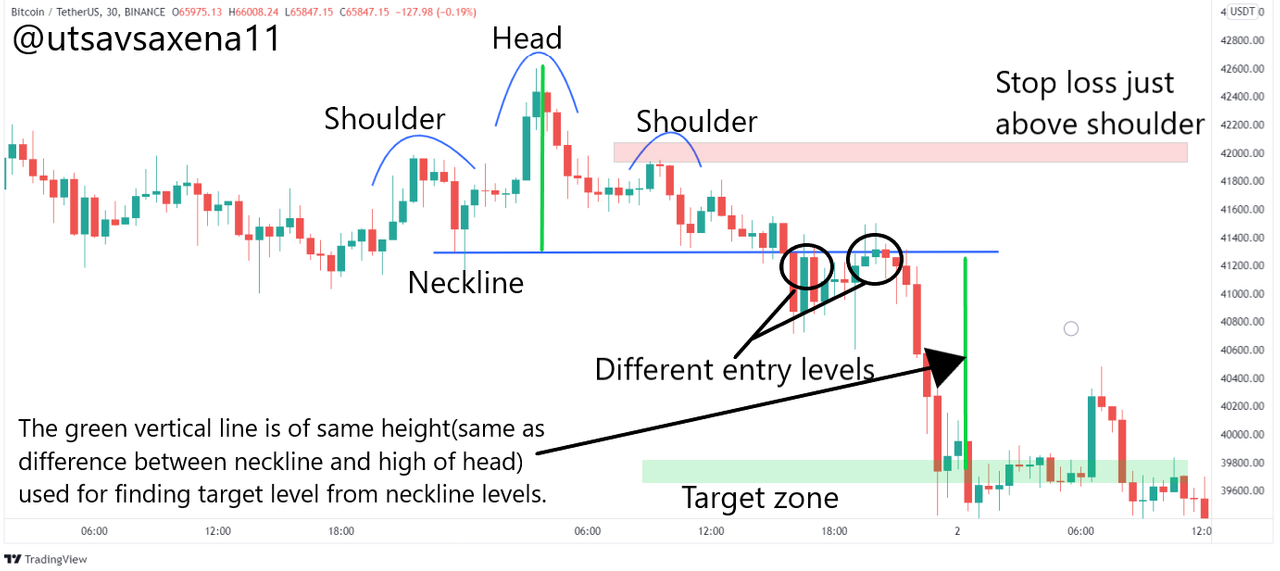
Generally, when the price goes below the neckline level, one can take entry at the next candle after the breakout. If you are a safe trader, you can wait for the price of asset to retest the neckline level after the breakout. Once the price retest, and again moves in the breakout direction, you can take entry at these levels also.
Stop-loss levels
For the Head and Shoulder pattern, one can place stop-loss levels just above the right shoulder's peak. If you want to take more risk you can also place a stop loss just above the head peak but this is not suggested as this will reduce your risk-reward ratio.
Target Levels
In the case of Head and Shoulder Pattern, we get target profit levels by following these steps : ,
First, we take the difference between the head peak level and the low point of either shoulder.
This difference that we get in the above step should be subtracted from the neckline price level to get the target price level.
For example -
If the head peak is at $100 and the low of the shoulder is $80. So, the difference is $20. Now, this difference should be subtracted from the neckline level(in this case low of the shoulder) of $80 to get the target level for sell-side trade. which is $(80-20)60.
You can check all these levels in the basic structure of trade in the Head and Shoulder pattern picture above.
Inverse Head and Shoulder Pattern
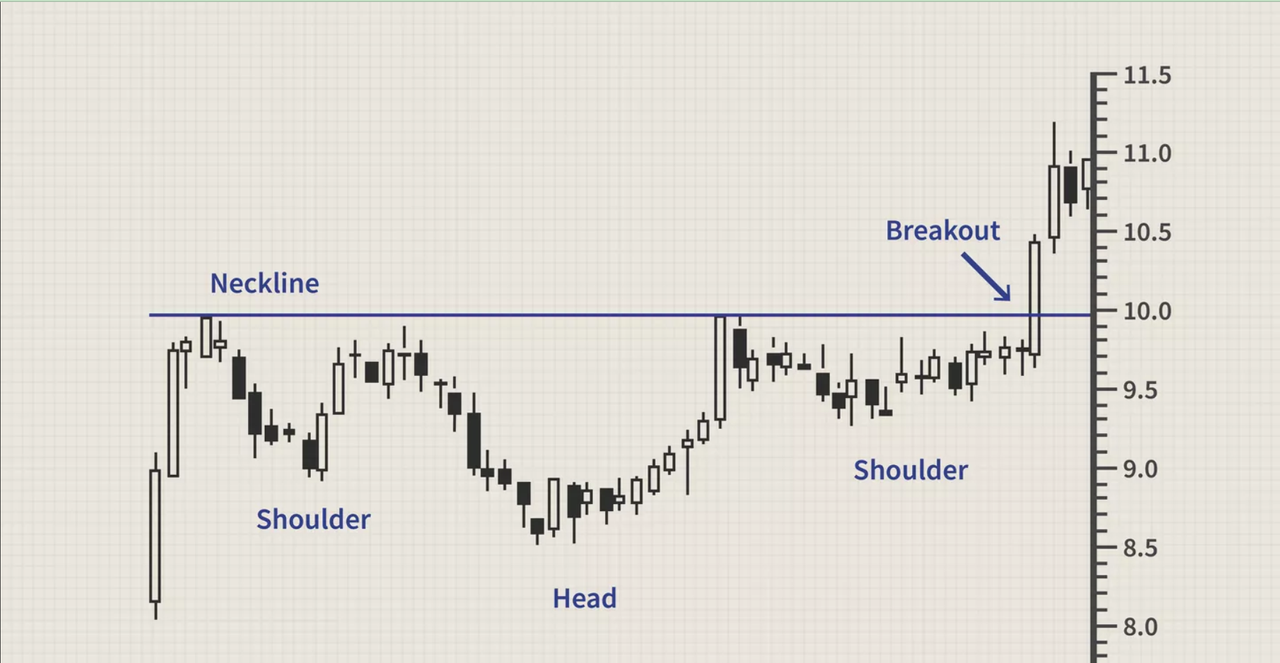
Inverse Head and Shoulders patterns are exactly opposite of Head and Shoulders patterns as the name suggests. The inverse Head and Shoulders pattern is also one of the best patterns for trend reversal.
Inverse-Head and Shoulders is a very basic candle structure of technical analysis, this structure formation predicts a bearish-to-bullish trend reversal.
Inverse Head and Shoulders pattern is used to identify a bearish to a bullish trend reversal. Using this pattern we can make good buy-side trades.
.png)
Same as the Head and Shoulders pattern, Inverse Head and Shoulders pattern also has three components :
1. Left Shoulder : When the price of an asset goes in the downward move and makes a price bottom followed by rising in price.
2. Head : After the formation of the left shoulder the price of asset again rises and falls making a lower bottom than the Left shoulder's low.
3. Right Shoulder : After formation of Head, price of asset rise again and falls making a right bottom.
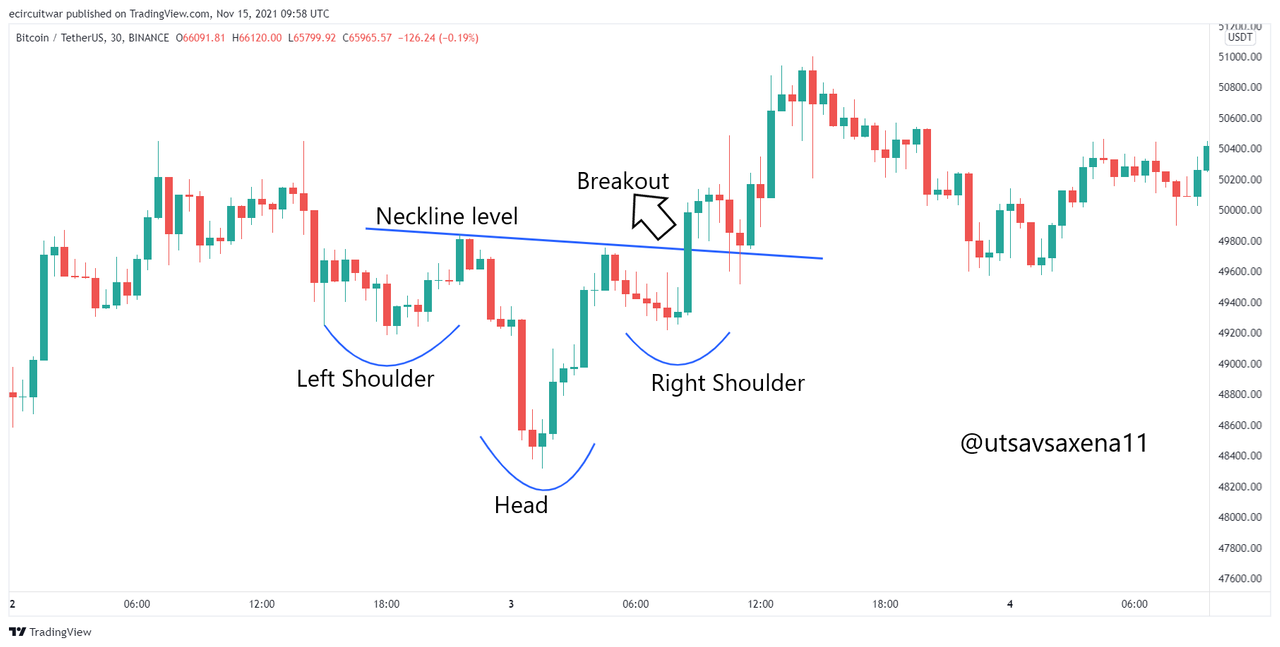
Same as the Head and Shoulders pattern, this Inverse Head and Shoulders pattern is very rare to be formed perfectly so you can find some noises in the left shoulder and right shoulder.
Trading with Inverse Head and Shoulders Pattern
First, we need to find the complete structure with the left shoulder, head, right shoulder. Once we found the complete structure, now we have to draw a neckline. In the case of inverse head and shoulders pattern, the neckline should be drawn by joining the high formed after the left shoulder and the high formed after the head.
Once the neckline is drawn now we have to wait for the price of asset to break these neckline levels. In inverse head and shoulders pattern, the price of asset should break the neckline in an upward move after the right shoulder is formed.
Once all these conditions are satisfied we can make a buy-side trade. As Inverse head and shoulders pattern is used for a buy-side trade.
Let us now look at different levels of trade using the Inverse head and shoulders pattern
.png)
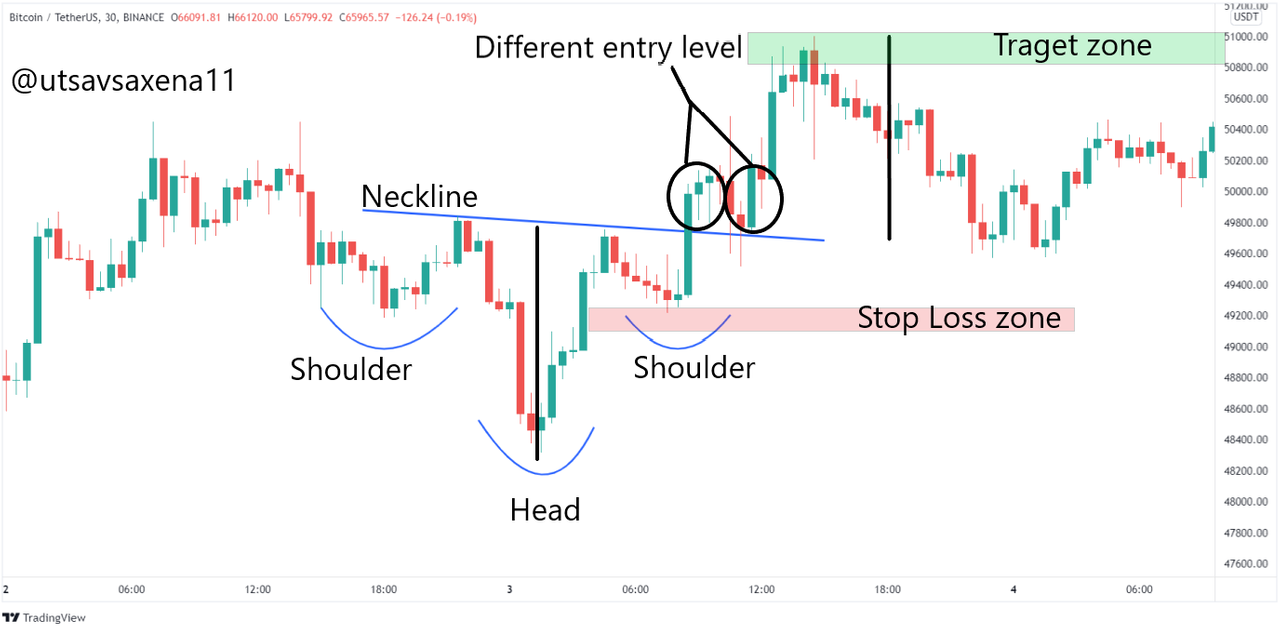
Entry using Inverse - Head and Shoulders pattern
To take entry using this pattern, first, the pattern should be completed. We take entry for a buy-side trade when we use Inverse Head and Shoulder Pattern.
Generally, when the price goes above the neckline level after the right shoulder, one can take entry at the next candle after the breakout. If you are a safe trader, you can wait for the price of asset to retest the neckline level after the breakout. Once the price retest, and again moves in the upward direction, you can take entry at these levels also.
Note -
In case of both, Head and Shoulders Pattern and Inverse- Head and Shoulders pattern :
The breakout levels are usually followed by high volumes. If you find high volumes at the breakout levels you can be sure that this is a good level for the trade.
Stop-loss levels
For the Inverse-Head and Shoulder pattern, one can place stop-loss levels just below the right shoulder's peak. If you want to take more risk you can also place stop loss just below the head peak but this is not suggested as this will reduce your risk-reward ratio and open you to a larger risk.
Target Levels
In the case of Inverse-Head and Shoulder Pattern, we get target profit levels by following these steps : ,
First, we take the difference between the head peak level(lowest level of head peak) and the high point of either shoulder.
This difference that we get in the above step should be added to the neckline price level to get the target price level.
For example -
If the head's lowest point is at $80 and the high of the shoulder is $90. So, the difference is $10. Now, this difference should be added to the neckline level(in this case high of the shoulder) of $90 to get the target level for buy-side trade. which is $(90+10)100.
Limitations of these patterns
As nothing is perfect, neither of these patterns is perfect. Some of the drawbacks if you trade with Head and Shoulders pattern are :
It takes a long time to find the complete pattern so this is a strategy that requires time.
The target levels are not always reached, so the trader needs to be cautious about this.
The patterns are sometimes not formed perfectly so not able to trade that if the pattern is forming great but the right shoulder has a large price movement, so this will ruin the complete pattern.
Conclusion
Head and Shoulders patterns are very important trend reversal patterns used in technical analysis. The best thing about these patterns is that they can be found in all the time frames and can be seen easily on price charts.
Head and Shoulders patterns consist of three components: Left Shoulder, Head, Right Shoulder. Once you find the complete pattern, you can easily find all the levels like entry-level, stop loss level, target levels.
Generally, entry-level should be at the breakout of the neckline level and stop-loss levels are above/below the right shoulder. These patterns are easy to find but is it hard to find a perfect pattern so there might be some noises in your pattern.
Homework
Before you start homework task try to read this article atleast twice. Try to do proper research and give answers to following questions :
1. Explain Head and Shoulder and Inverse Head and Shoulders patterns in details with the help of real examples. What is the importance of voulme in these patterns(Screenshot needed and try to explian in details)
2. What is the psychology of market in Head and Shoulder pattern and in Inverse Head and Shoulder pattern (Screenshot needed)
3. Explain 1 demo trade for Head and Shoulder and 1 demo trade for Inverse Head and shoulder pattern. Explain proper trading strategy in both patterns seperately. Explain how you identified different levels in the trades in each pattern(Screenshot needed and you can use previous price charts in this question)
4. Place 1 real trade for Head and Shoulder(atleast $10) OR 1 trade for Inverse Head and Shoulder pattern(atleast $10) in your verified exchange account. Explain proper trading strategy and provide screenshots of price chart at the entry and at the end of trade also provide screenshot of trade details.(Screenshot needed.)
Homework Rules and Guidelines
Read all the given guidelines and instructions carefully.
Homework assignments must be posted in the community Steemit Crypto Academy.
THERE WILL BE NO APOLOGY FOR PLAGIARISM IN STEEMITCRYPTOACADEMY.
According to the latest rules, only people who are actively participating in the #club5050 are eligible to take part in Crypto Academy homework assignments. check your eligibility before uploading homework post. #club5050 status (last one month) is a prerequisite to participating in this homework task. The minimum threshold for Club5050 is 150 SP power up in the last one month regardless of the payout and earning. This is applicable for both active and inactive users. The upper threshold is subject to your cashout and earning for the specified period(i.e. last one month).
Post title must be written in the format "Head and Shoulders and Inverted Head and Shoulders Pattern- Steemit Crypto Academy- S5W2- Homework post for @utsavsaxena."
The minimum reputation to take this class is 60.
The minimum Steem Power that must be owned is 600 SP. (Not including delegated)
Accounts that are powering down are not allowed to take this class.
The minimum number of words in the post is 500 words.
Use images that are Copyright-free and list the source of these images.
All screenshots taken must be given a watermark that includes your username.
Put the tag #utsav-s5week2, and #cryptoacademy in the first 5 tags of the post.
User must include their respective country tags in homework assignment.
Do proofreading before uploading your homework post and check tags 2-3 times.
Put the task link in the comments column if it has not been rated for 2 days or more.
Real transactions should happen from your verified account. (screenshot required)
Justifying the text is necessary and the users from India are requested to add #India as one of the tags.
Homework assignments deadline is until November 27th 2021 at 23:59 UTC.
CC:
@steemitblog
@steemcurator01
@steemcurator02