Hello Steemians, I trust everyone is doing great. Today, we will be analysing the crypto market from a technical perspective to understand the current situation of the market. In other to do this, we will be analyzing the global chart and also the Bitcoin market.
Bitcoin is chosen because of its dominance in the crypto market. Every other cryptocurrency in the market follows the trend of Bitcoin. Furthermore, we will be analyzing the market on Tradingview.com.
The crypto market has been in a continuous downtrend since after its all-time high. The bearish momentum has been strong that major support levels couldn't hold price. Like I will always say, this bear market is part of the market cycle. Price will continue in a certain direction until there's a trend reversal.
Let's go ahead and look at the cryptocurrency global chart.
Cryptocurrency Global Chart
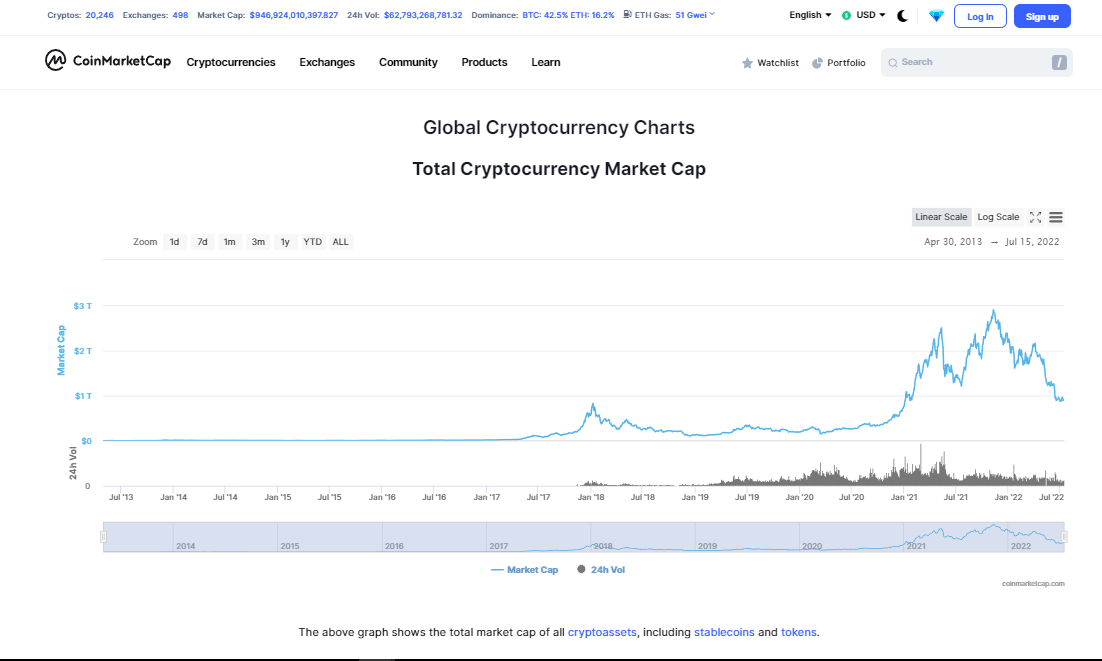
Looking at the cryptocurrency global chart from coinmarketcap, we have a total of 20,246 cryptocurrency and 498 exchanges in the crypto market. Also, the entire cryptocurrency market cap is $928.53 billion with a total trading volume of $50.68 billion across all platforms. Bitcoin still dominates the crypto market with 42.5% followed by Ethereum with 15.9%.
Technical Analysis
BTC/USD Monthly Chart
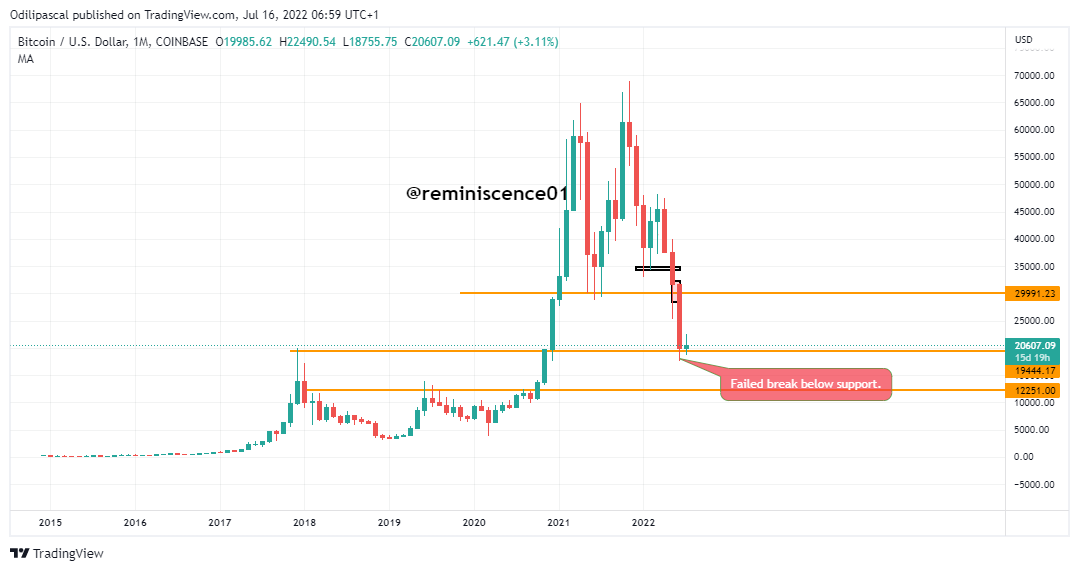
The chart above shows the monthly chart of BTC/USD. Looking at the chart, we can have a clear picture of the market and also the candlestick dynamics. I always recommend using the higher timeframe like the monthly, weekly and daily chart for market direction. The reason is that you will have a clear picture of the market. Also, price manipulations and noise in the market are filtered in the higher timeframes.
Looking at the chart above, we can see that Bitcoin hit its all-time high in November 2021. Since then, Bitcoin has failed to record a new high. Price reversal took another turn with BTC breaking below major levels of support to continue the downtrend.
Currently, price is testing the $19k support level which is a major support level in the market. The previous monthly candle broke below the support level but failed to close below it. At this point, we can't confirm that price has broken the support level. We hope this $19k level will hold price and will be a potential price reversal point.
Let's look at the weekly candle for further illustration.
BTC/USD Weekly Chart
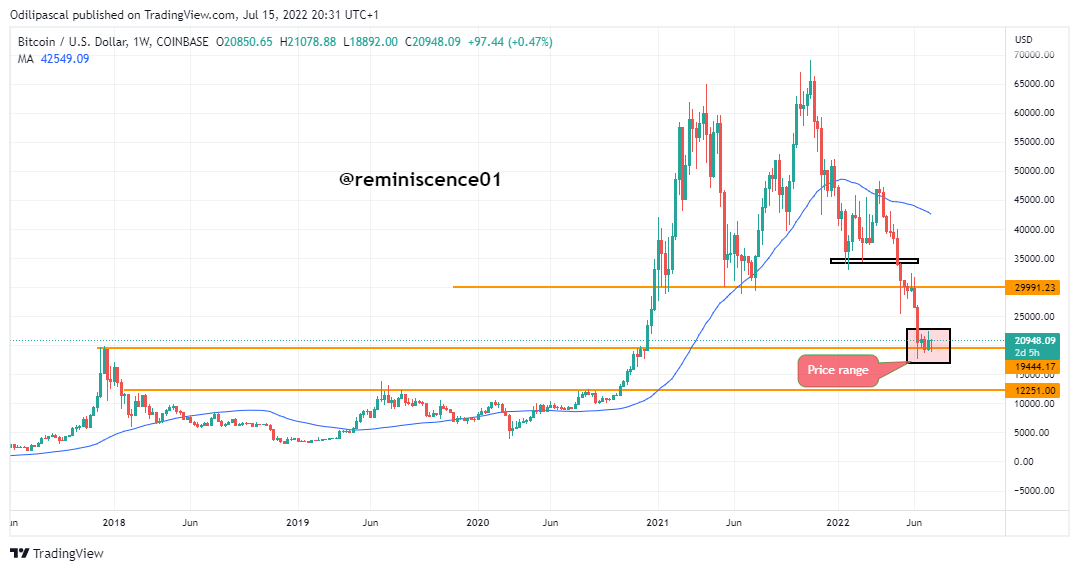
Looking at the weekly chart, we can have a good picture of what is currently happening at the support level. We can see price range at the support level with multiple retests. The candlesticks tried breaking the support level but failed to close below. This is a strong indication that price is being rejected at this level. But at the same time, we won't disregard the fact that this support level can still be broken.
BTC/USD Daily Chart
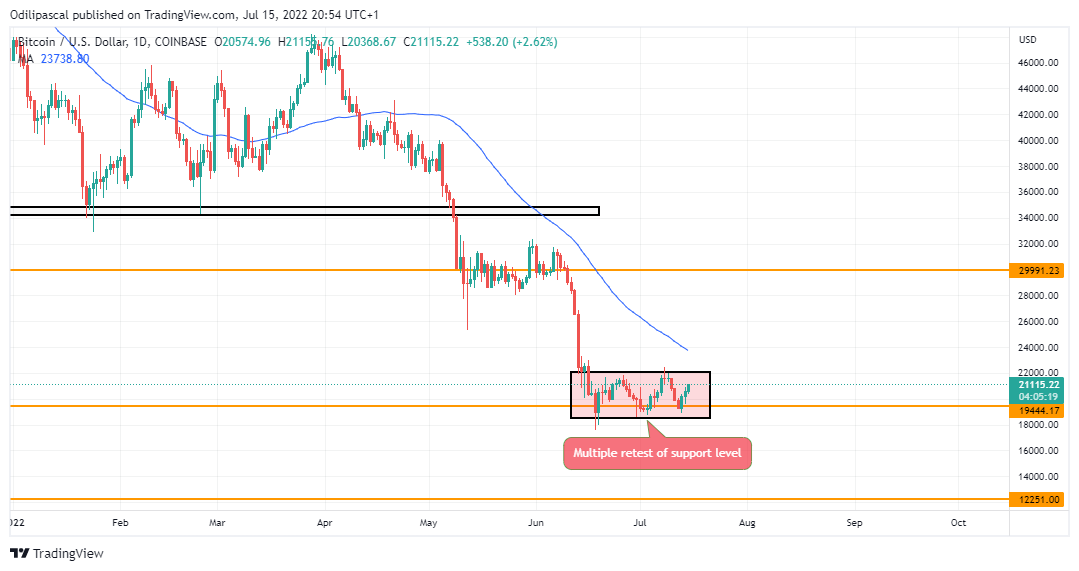
The chart above shows the daily chart. Here we can see the dynamics of the candlestick at the support level. Price has been in a range for some weeks now with low momentum. According to Wyckoff's theory, this stage of the market can be said to be the redistribution phase of the market. Price is gathering momentum for the next phase.
Also, this phase can be an accumulation phase of the market for price reversal. The Wyckoff method is in confluence with the market structure. But anything can happen in the market and the expected breakout can be in any direction.
Predicting the Next Direction of BTC/USD
In this section, we will be predicting the possible price movement of BTC.
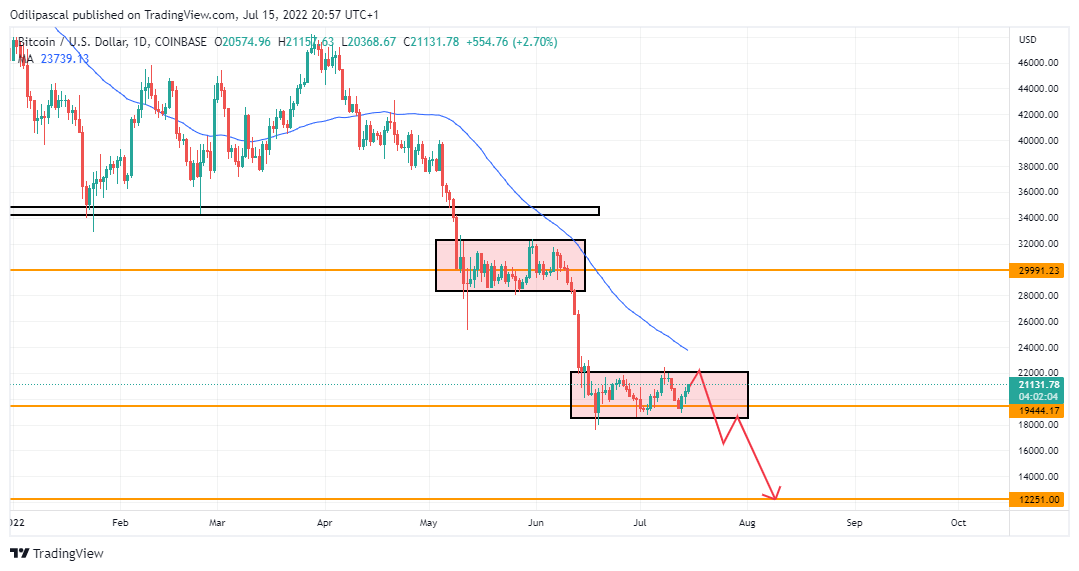
The first scenario shows the continuation of the downtrend which will see price at the next support level at $12k. Like I said in the previous section, this support can be broken for the bearish continuation. This similar situation happened at $31k support after multiple price rejections, price finally broke the support for the $19k support level. But we hope that's not the case this time. We will want to see a reversal in the market.
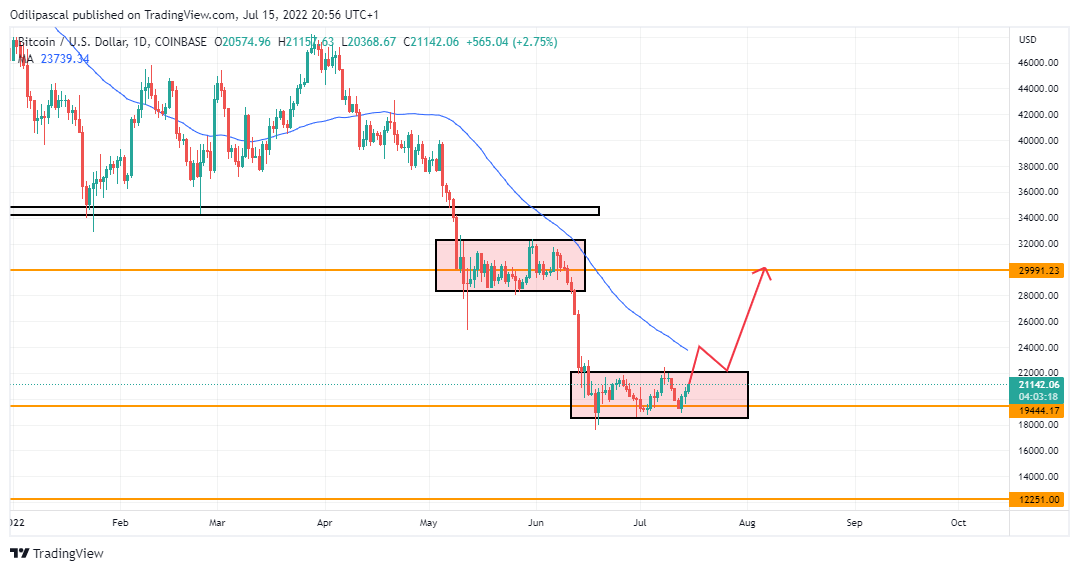
The chart above shows the next possible price movement of BTC. This time around on the positive side. A breakout above the range will be good for the market as the next possible retest will be the broken support at $30k.
In this post, we have analysed the crypto market while making reference to the BTC market due to its dominance in the market. Currently, price is still bearish and hasn't shown any signs of reversal. Investing in the market right now requires a high level of experience to make the right decision.
Note: This analysis is based on my personal opinion and knowledge. This is for educational purposes and not a piece of investment advice. Please do your own research and invest what you can afford to lose. The crypto market is highly volatile and risky.
Cc: @reminiscence01
