To trade crypto properly we need some technical tools and one of the technical indicators that is not very popular yet very effective is the Aroon Indicator. In this post today, we will be looking at the in-depth review of this tool to understand how it functions. Let's get started.
Aroon indicator was developed by Tushar Chande in the year 1995. The indicator though not very popular but has a lot of features which has made it stand out among others. It is specially designed to measure the direction and strength of the market. So when we need to determine the trend of the market and its strength, the best indicator to use is the Aroon indicator.
It is important to mention here that two basic lines make up the Aroon indicator and this line works within a range or scale of 0-100. The lines are called the Aroon-Up and the Aroon-down line. Now let's look at the lines one after the other.

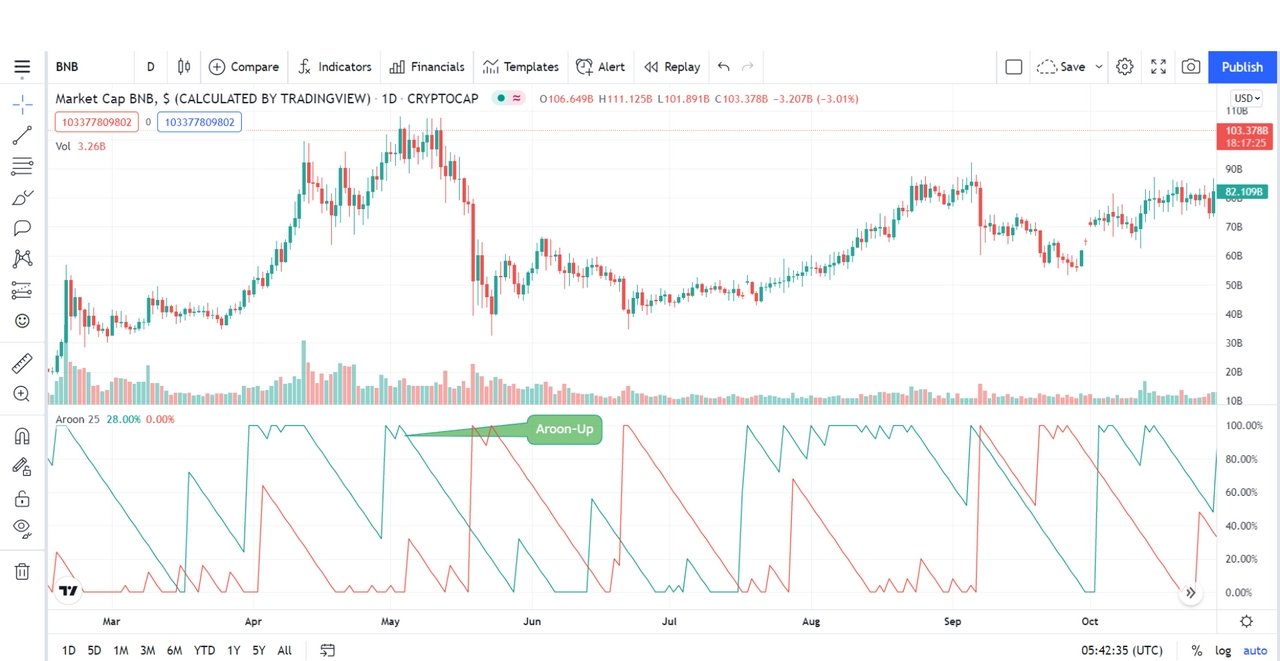
The Aroon-Up line is the line that indicates that the market at that point is in its uptrend or bullish movement. So to measure the strengths of the uptrend of the market within a given period or when the market is in its bullish phase, the Aroon-Up is used.

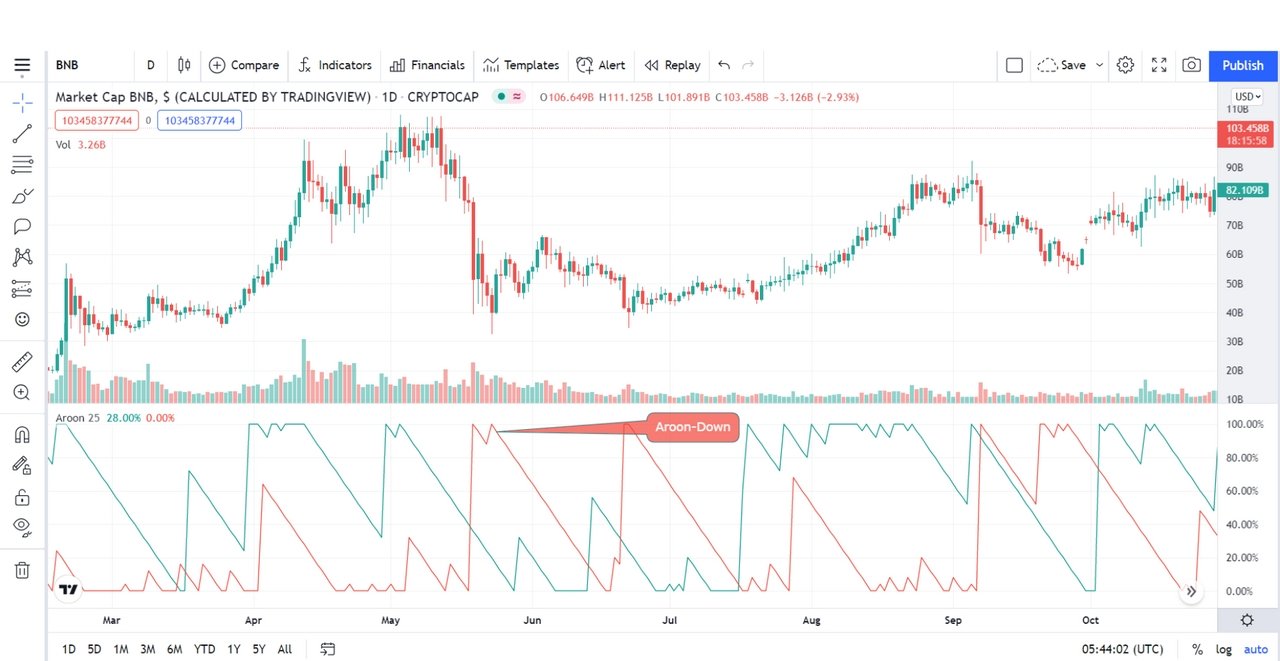
The Aroon-Down line is the line that indicates that the market at that point is in its downtrend or bearish movement. So to measure the strengths of the downtrend of the market within a given period or when the market is in its bearish phase, the Aroon-Down is used.
To better understand the Aroon indicator, one must be aware of how the two lines in the indicator work. So here in this section, I will be explaining and sharing some screenshots as to how both lines work. Let's look at them more carefully below.
The major thing that one needs to be aware of is the position of the line over each other as their position determine the direction of the trend while the scale determines the strength of the trend.
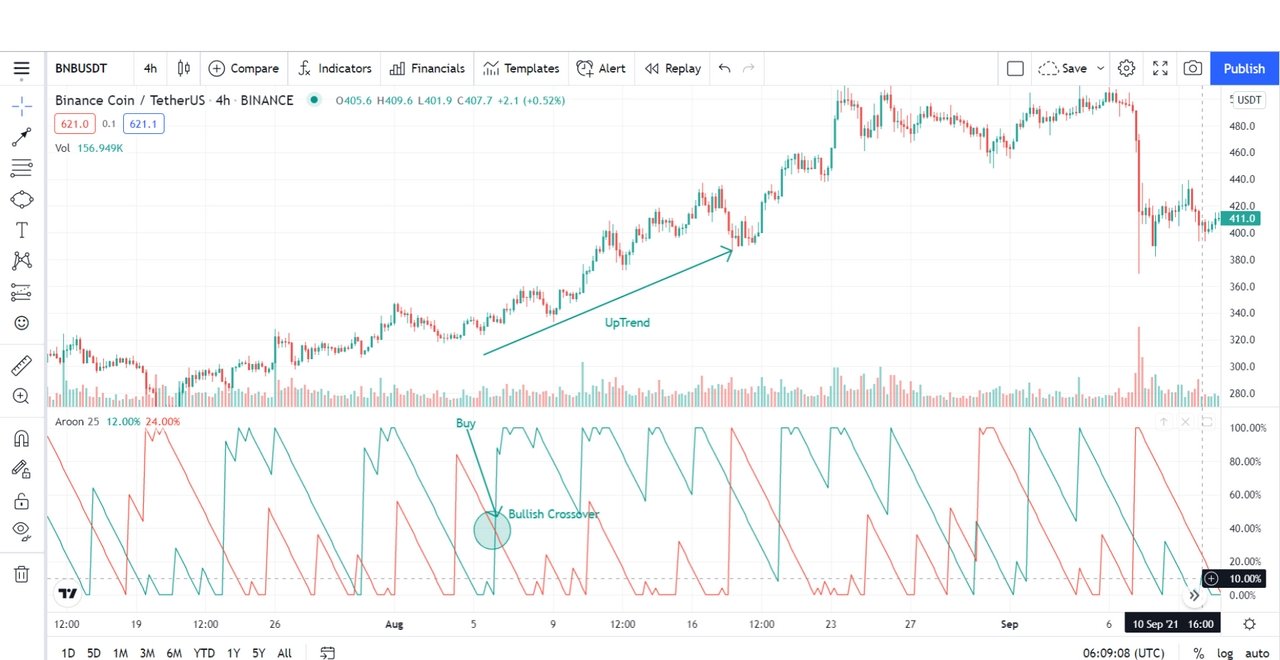
For uptrend identification, you will notice the Aroon-up line seen above the Aroon-down line. Looking carefully at the screenshot below, you will notice that the green line which represents the Aroon-up is seen above the Aroon-down. That alone tells you the direction of the market.

For the strength of the indicator, since the indicator uses a scale of 0-100, when the lines both that of an uptrend or downtrend I.e Aroon-up and Aroon-down respectively, are seen above 50, it implies that that trend is a stronger trend and anything below 50 is been as a weak trend.
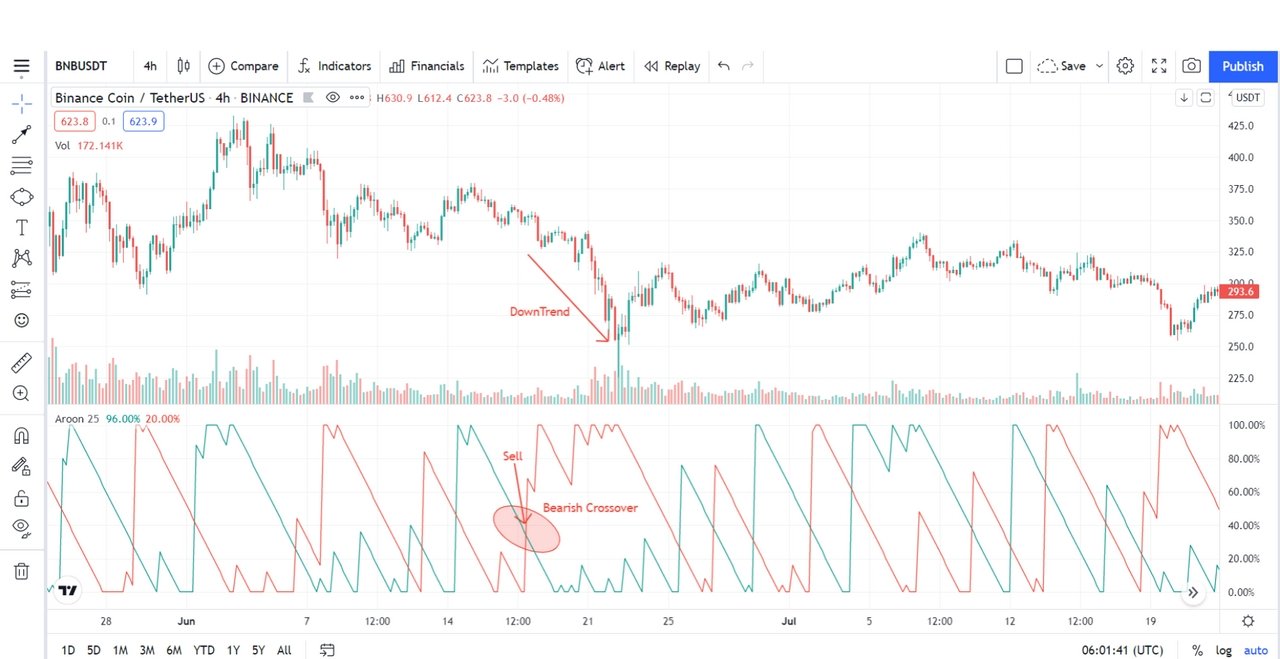
For downtrend identification, you will notice the Aroon-down line seen above the Aroon-up line. Looking carefully at the screenshot below, you will notice that the red line which represents the Aroon-down is seen above the Aroon-up. That alone tells you the direction of the market.

It is important to mention here that any crossovers are possible trend reversals. For example, when Aroon-up crosses Aroon-down and then moves downward and the other moves upward it is an indication that the trend will reverse to the bearish direction.
In other not to board you guys with too much information, I have decided to break this course into two sections, and in the next class, we will be learning among other things how is aroon-up/aroon-down calculated, the Steps involved in the Setting Up Aroon indicator on the chart and show different settings, etc.
Note: All screenshot are taken by me from the tradingview website were i perform my analysis from.
