Yesterday, we discussed understanding crypto charting where our focus was on the Aroon Indicator. I said we will have to break it up into two parts for more clarification for those who are slow learners.
We discuss the history of the indicator and how the indicator works as we took into consideration Arron-up and the Aroon-down lines. As of today, I will be discussing more in-depth with practical illustrations on how we can add the Aroon indicator to our charts.
To set up the Aroon Indicator follow the following steps carefully.
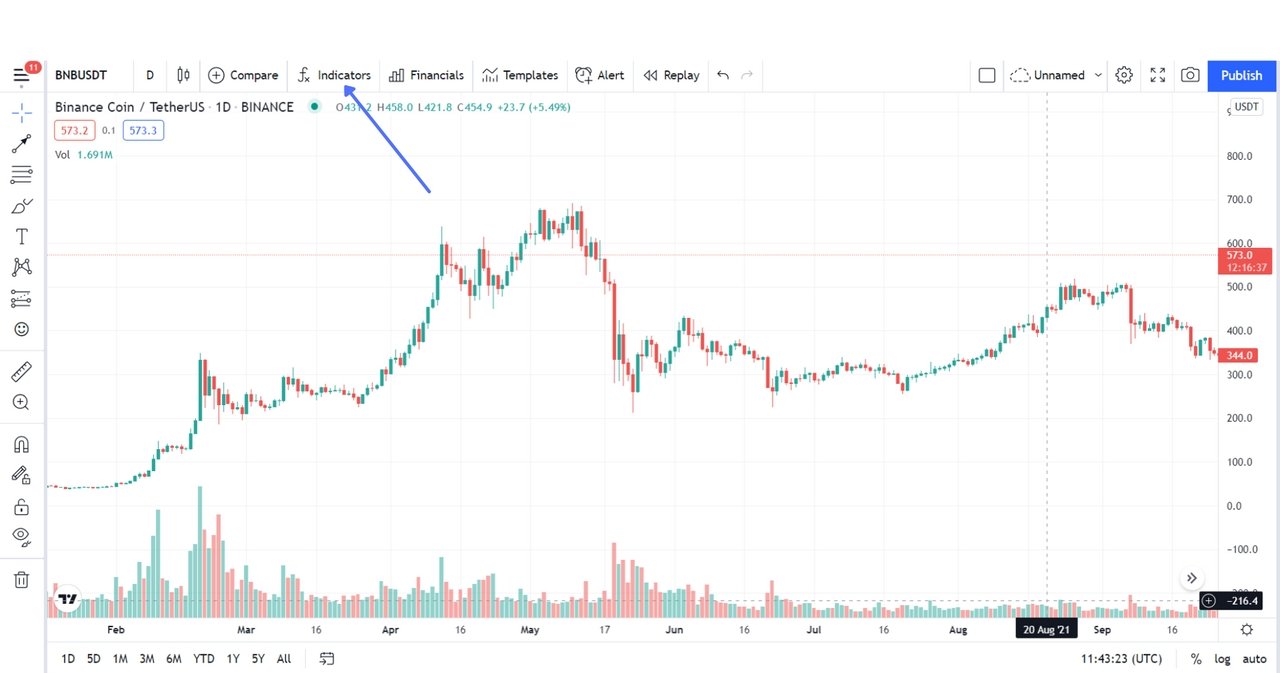
Step 1: Go to Trading View and chose a chart of your choice then select "fx indicators" as seen below.
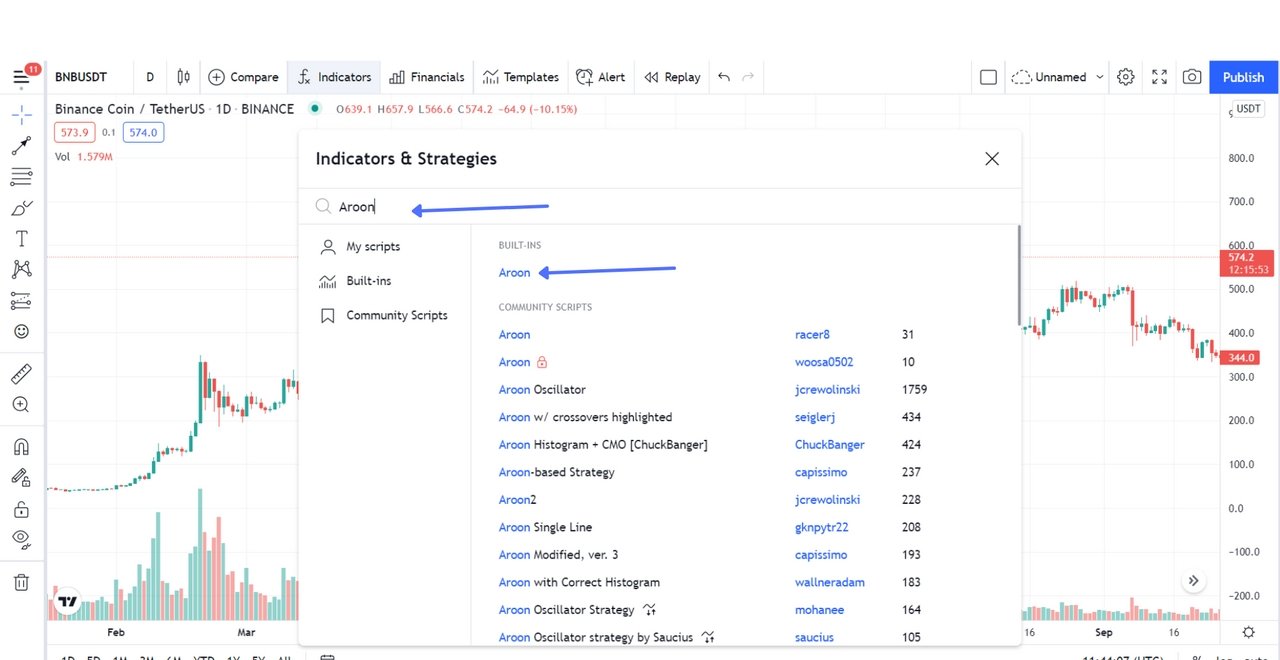
Step 2: On the menu, search for Aroon and select the indicator as seen in the image below
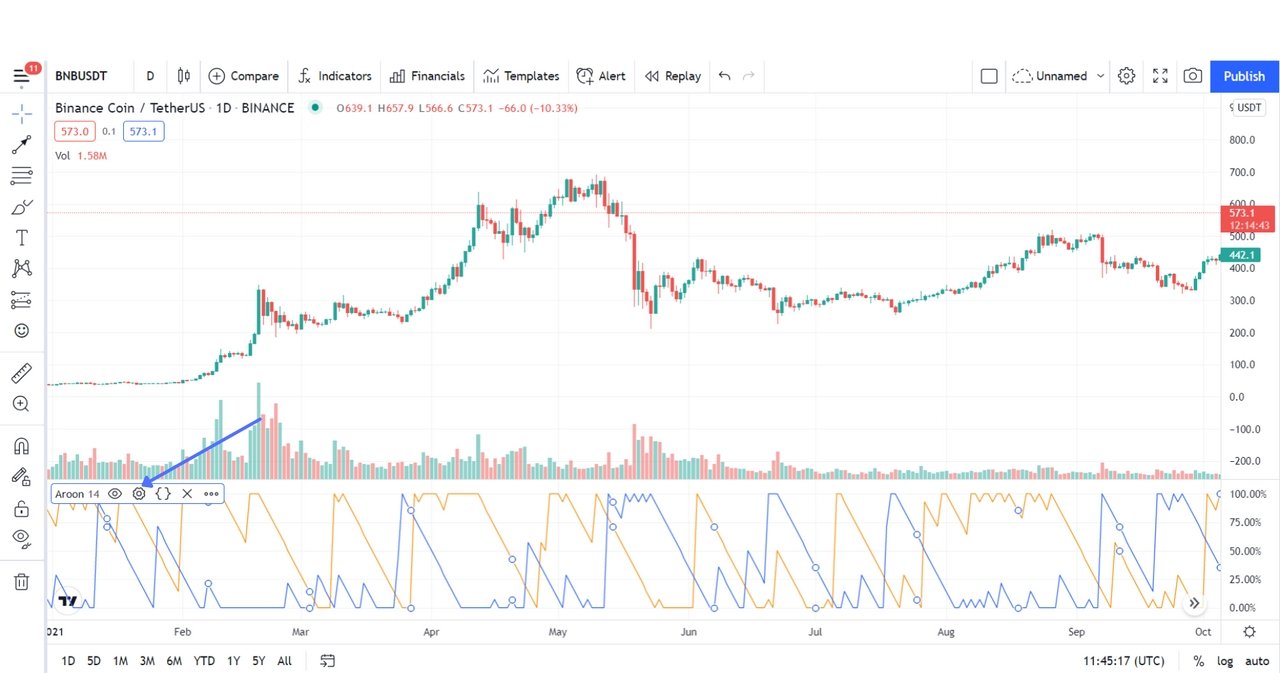
Step 3: Once you have selected the indicator, click on the settings button to load the setup as seen in the image below.
i) In the section of the input, the following are seen and can be modified. See details in the below image.
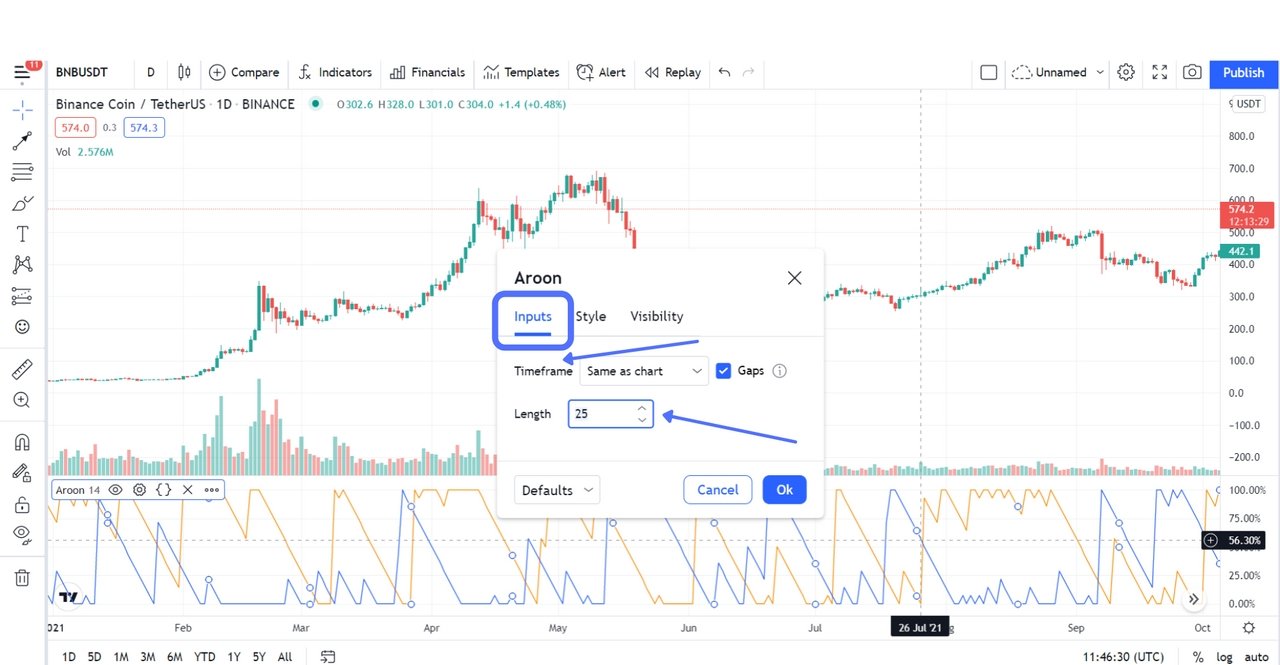
Timeframe talks about the time the indicator will follow during the analysis.
Period or length talks to the time or periods which is indicated with N, it can be in minutes, hours, days, months, etc. The default length is usually 14 but can be modified as in my case above.
ii) In the section on style, the following are seen and can be modified.
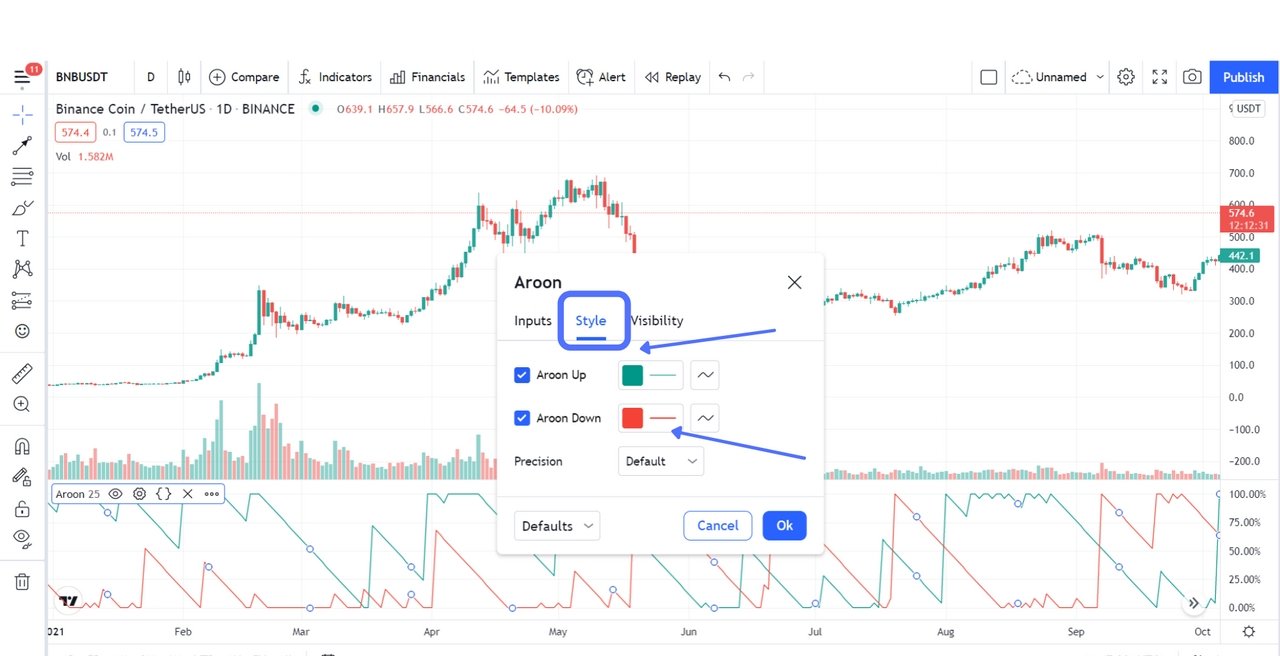
The color is one of the major things to modify in this section. By default Aroon-up is red and Aroon-Down is blue but because of this practice, I have modified and changed the color.
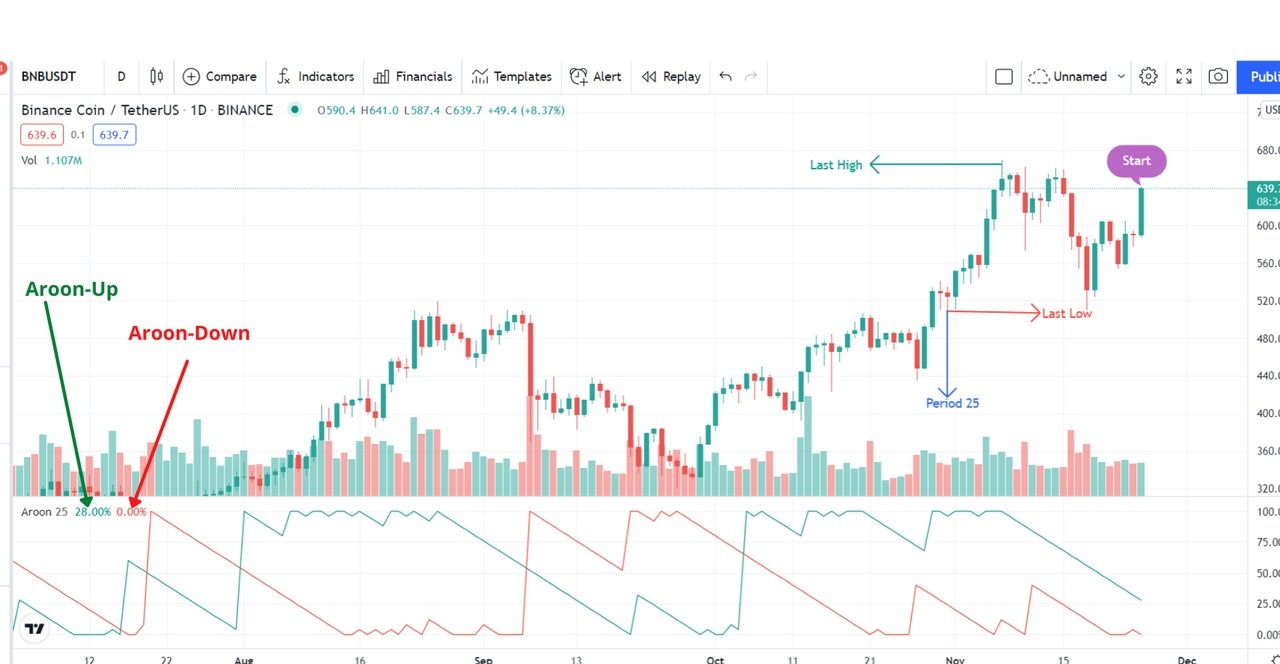
To calculate the Aroon-Up/Aroon-Down, the formula to use can be seen below.
Aroon-Up/Down = [(N - Periods Since N period High or Low)/N] x 100
N is the period and by default, it's always 14.
In this task, I will be using 25 as that is used more often by traders to get a better result.
By setting N to be 25, it implies that to begin we need to count 25 candles before the most recent candle, and from the above image, I have labeled that spot as "Period 25".
So let's begin with the Aroon-Up line:
From the formula,
Aroon-Up = [(N - Periods Since N period High)/N] x 100
Where N = 25
Aroon-Up = [(25 - Periods since 25 periods high)/25] x 100
The highest candle as seen in the image above is marked with "Last High". After the high, I total of 18 candles was recorded hence substituting 18 in the equation will yield.
Aroon-Up = [(25-18)/25] x 100
= (7/25) x 100
= 0.28 x 100
= 28.00 (as indicated in the image above)
Similarly, To Calculate the Aroon-Down line:
From the formula,
Aroon-Down = [(N - Periods Since N period Low)/N] x 100
Where N = 25
Aroon-Down = [(25 - Periods since the 25 periods low)/25] x 100
Here, the last candle is the lowest candle as we can see in the screenshot above. I have marked it as "Last Low". After the low, I total of 25 candles was recorded hence substituting 25 in the equation will yield.
Aroon-Down = [(25-25)/25] x 100
= (0/25) x 100
= 0 x 100
= 0.00 (as indicated in the image above)
I want to believe that all those who had time to go through part 1 and this part 2 of my tutorial will be able to make use of the Aroon indicator as I have made its explanation straightforward. We have given a practical illustration of how this indicator can be added to a chart, and we have also talked about how to carry out some mathematical calculations.
There are still a few things that needed to be discussed about the Aroon indicator and for that reason, we may be having part 3 of this course as well. If you have any questions or contributions please share in the comment section.
