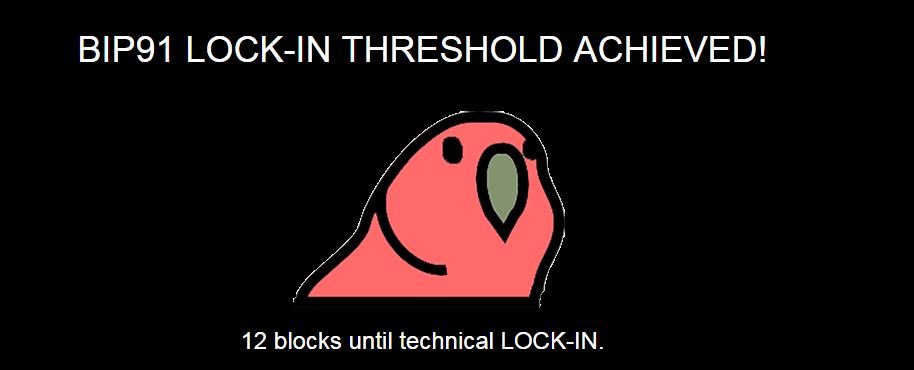
A big day for Bitcoin as the soft fork is signalled. A contrarian call on US Retail. Continue to build exposure to Italy and Uranium and India. Not everything is roses with a disappointing move on Macquarie Bank - against the trend for Australian Banks.

Bought
SPDR® S&P Retail ETF (XRT): US Retail. You will think I am crazy buying into US Retail especially after I wrote about it relative to Walmart and Amazon in TIB82 and TIB98. I was listening to one of the talking heads (from Blackrock) on Bloomberg TV talking about all the data that has come in this week that is pointing to a solid US economy - job quits, housing starts, consumer confidence, Congress switching attention to tax reform and regulatory reform after the healthcare event fell over. Then the Sears - Amazon story popped up and Sears price popped 10%.

The talking head also said there were not many under-valued areas left in the US market, apart from energy. I have energy covered. Apart from that I have very little exposure to the US outside of technology and financials. What is left is the elephant in the room and one of the bellwether retail stocks just popped 10%. What does the chart show - a beaten up stock showing signs of life perhaps. If the data is right, this sector is not totally dead, it could well come back to life for a nice run.
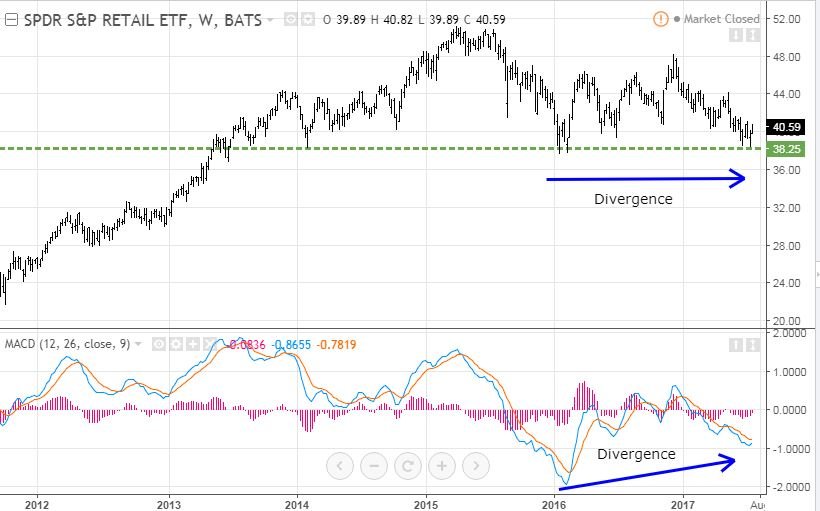
Now that I look at the chart in a little more detail, I see a strong horizontal level off the weekly (the green dotted line) and I notice that the momentum indicator (MACD in the lower window) is showing divergence [Means: Price was showing level lows and MACD was showing higher lows]. Instinct (or experience) is telling me that the sector has been oversold and this could be the last under-valued sector in the US market. The next chart is a buy:sell chart buying the US market (represented by the SPDR S&P500 ETF (SPY)) and selling retail (represented by the SPDR Retail ETF (XRT)).
Buy:Sell Chart [Means: Buy the first named stock and sell the second named stock. if the chart goes up the first named stock is outperforming. If the chart goes down the second name stock is outperforming]
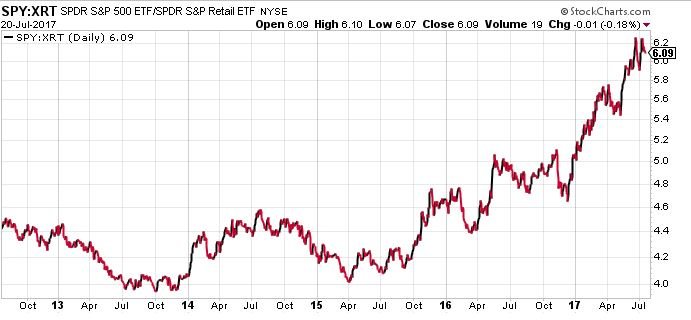
This chart tells me that US Retail has under-performed the US market since early 2015. It is too early to say that the chart has turned over though it has had one go at making a lower low. The chart tells me I might be early on this call and I could be wrong. My instinct says the data is solid and I am right.
ComStage MSCI Italy TRN (CBITA.SW): Italy ETF. A few days ago I sold European Mid Caps to raise Swiss Francs. The same talking head was talking about their bias towards Europe. Well I like Europe and I am investing in the under-valued side of Europe. Is there an ETF listed in Switzerland that focuses on Italy? I picked this one because it has the lowest expenses ratio at 0.25%. A quick reminder on the Italy thesis - invest in countries with the lowest Price to Book Value ratio. So far I invested in Italy overall via options in FTSE MIB - this is a stock purchase (see TIB107 for the Italy rationale)
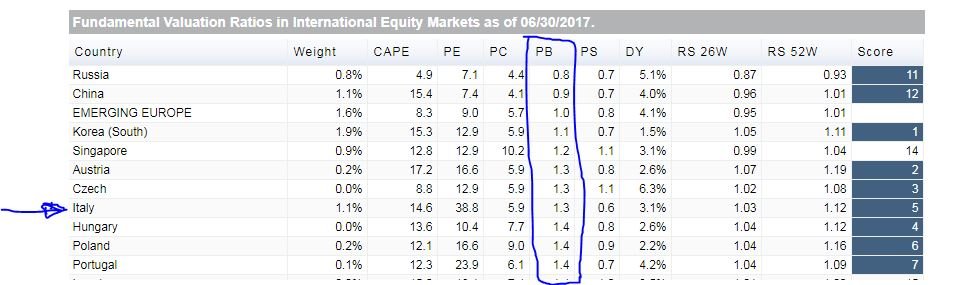
http://www.starcapital.de/research/stockmarketvaluation
UnipolSai Assicurazioni S.p.A. (US.MI): Italian Insurance. My holding in this Italian insurance company is small. I am actively investing in European insurance and this is a relative under-performer which has dropped by 5% since my initial purchase - this is a top up to average entry price down.
Centrus Corp (LEU). US Uranium Enrichment. Uranium stocks have been advancing across the board - see the failed breakout in the Global X Uranium ETF (URA).

Time to try again. I have a covered call outstanding on Cameco Corp (CCJ) which is likely to be exercised this Friday. My small holding in Centrus is unprofitable. This trade averages down the price entry and keeps me invested in Uranium if Cameco gets exercised away.
Wisdom Tree India Earnings ETF (EPI): India ETF. I bought January 2019 strike 28 call options for 5.9% premium to strike and 6.3% to $25.98 closing price. The India growth story is looking solid and the market has digested the negative impact of the US H-1B visa restrictions on Indian Software Houses now. I have been active in India for some time and I have built a staircase of options in EPI. Price is about to pass the next rung in the staircase ($26) which means I will soon be taking profits on the 24 strikes I am holding. This trade puts in the next rung.
What do the charts say?
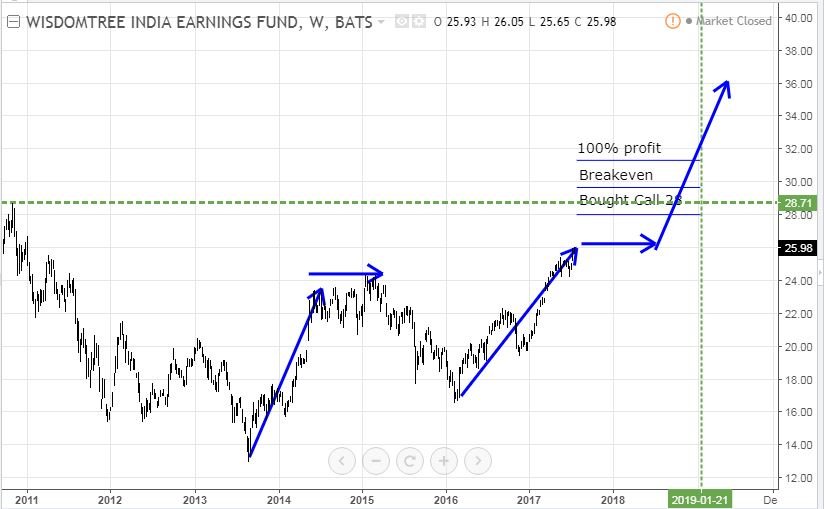
The chart shows the bought call (28), breakeven, and 100% profit as blue rays with the expiry date the dotted green line on the right margin. The bought call is just below the last highs from late 2010 (the green dotted line across the chart). As always I am looking to past patterns to see if I can win - this one might be a blue sky call. The rising blue arrow on the left shows the last run up. I have cloned that across to the current situation (but I did change the slope). I have taken note of the consolidation phase (the horizontal blue arrow) and assumed we could get one now. Then I cloned another run-up using the left hand arrow. That shows price clearing 100% profit - just before expiry in January 2019.
I think that price is more likely to move faster than that. All the talking heads are positive on India. GDP growth has now overtaken China.
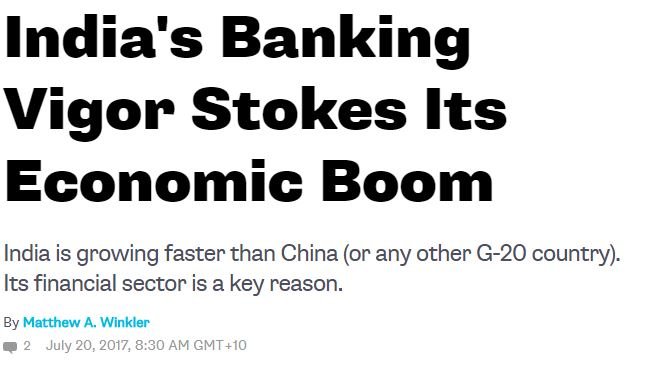
https://www.bloomberg.com/view/articles/2017-07-19/india-s-banking-vigor-stokes-its-economic-boom
The economy is finding ways to overcome the cash squeeze caused by the removal of high denomination bank notes. The uniform sales tax (GST) across all states is going to generate more growth. Japan investors are keen. I am not hearing a lot of negatives.
Sold
Sony Corporation (SNE): Japanese Electronics. sold a portion of my holding for a 35% profit since January 2017. This position arose as a result of stock option exercise - profit is 20.3% after accounting for the option premium. I remain interested in the stock and in Japan. They have some interesting investments playing out in areas like augmented reality.
Macquarie Group (MQG.AX): Aus Investment Bank. This pick from research house has not done what they expected. They issued an exit instruction - I chose to ignore it as I was happy with the logic of the trade. Trade stopped out for a 4.25% loss in 4 weeks. This move surprised me as the Australian banks have done quite well over the same 4 week period.
Cryptocurency
Bitcoin (BTCUSD): Well, Well, Well. That was some bounce as it seemingly becomes clear what is going to happen on the soft fork - it will be soft.
You will recall that I had 4 open trades which is exposure to 40 Bitcoin and have had to add margin to the account. I wrote several times that I was sitting it out. Well that paid off. This morning, two of my trades hit their profit targets, one was profitable this morning leaving only one exposed. As I write this - it is now two trades under water. Here is a price chart showing the bounce.
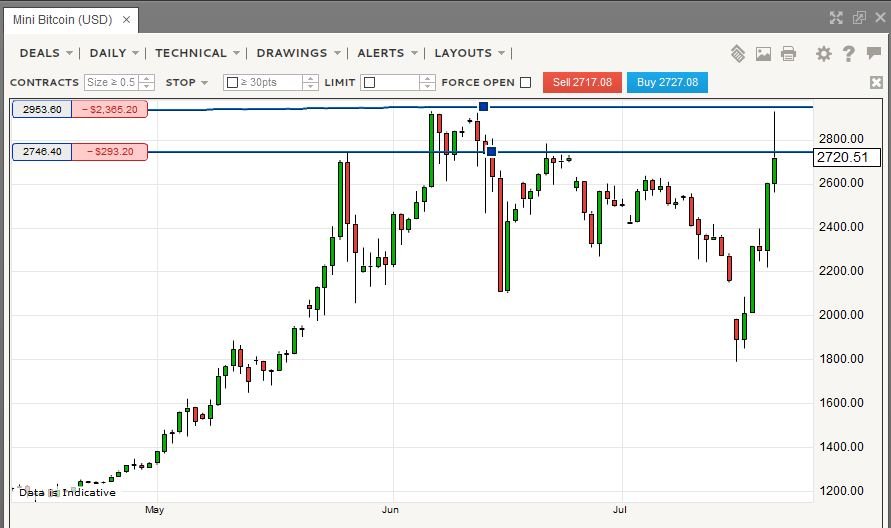
My two trades closed at $2650 and $2735 as price raced to go over $2900 at one stage. This is the profit result for the two trades that were closed: $45.1 per contract (1.7%) and $117 per contract (4.2%). You might well ask why the profit targets were so far apart. I had set the trades up to try to trade reversals back to the previous trade and had set profit targets between the losing trade and the new trade around price structure. That was the strategy and I had chosen to stick with it rather than play around.
Now that the need for the margin has passed, I have withdrawn the funds back to where it came from. That reduces the temptation to trade the additional funds.
Currency Trades
Forex Robot closed two trades (0.11% return) and is trading at a negative equity level of 5.01% (higher than prior day)
Cautions: This is not financial advice. You need to consider your own financial position and take your own advice before you follow any of my ideas.
Images: I own the rights to use and edit the Buy Sell image. News headline images come from Google Search. India growth image comes from Bloomberg.com. Bitcoin image comes from Xbt.eu. All other images are created using my various trading and charting platforms. They are all my own work
Tickers: I monitor my portfolios using Yahoo Finance. The ticker symbols used are Yahoo Finance tickers
Charts: http://mymark.mx/TradingView - this is a free charting package. I have a Pro subscription to get access to real time forex prices
Bitcoin: Now you Bitcoin is not dead and if you want a low cost way to enter Bitcoin, you can buy a package for as low as €50 (in Bitcoin) and earn Bitcoin at a rate way better than your bank could offer - think weeks instead of months. http://mymark.mx/USIBitcoin
July 20, 2017