This is next in my series of posts reviewing the amount and value of powered up STEEM on the Steem blockchain. For previous posts, see the end of this entry. After the FTX meltdown, there's no sugar-coating this one....
Noteworthy in the last week |
|---|
- Week over week, the number of powered up STEEM increased by about 691K SP, or 0.4%.
- Over the course of the week, we saw seven daily increases and seven new highs in the number of staked STEEM. The current streak of consecutive new highs stands at sixteen.
- The modeled value lost ground against all comparison tokens. Changes ranged from -34% against USD to -13% against ETH.
- In terms of all comparison values except for TRX and USD, the modeled value remains above its January 1 baseline.
- This week (Monday through Sunday) saw a total of 401K STEEM powered down, which is an increase of about 27% as compared to last week's 314K STEEM (Sunday through Saturday).
- I wasn't able to write this report during the day, so the comparison to previous and future reports may be skewed since we're now into November 14 for the GMT time zone.
Here are the numbers as-of a few minutes ago |
|---|
Total value locked in powered-up STEEM (USD): $24,275,090.87
Exernal STEEM market cap (coingecko) $57,447,026.50
Internal STEEM market cap (median_price * current_supply) $68,393,000.00
Locked value in terms of other tokens:
| token | price | locked value equivalent | Jan 1, 2022 | pct of Jan 1 baseline |
|---|---|---|---|---|
| tron | $0.05 | 482,903,795 | 809,173,538 | 59.68% |
| steem-dollars | $1.77 | 13,714,740 | 11,284,131 | 121.54% |
| bitcoin | $16,189.52 | 1,499 | 1,300 | 115.35% |
| ethereum | $1,194.82 | 20,316 | 16,501 | 123.12% |
| litecoin | $56.31 | 431,097 | 411,561 | 104.75% |
| steem | $0.15 | 166,786,383 | 142,930,214 | 116.69% |
| USD | $1.00 | 24,275,091 | 61,837,042 | 39.26% |
|
|---|
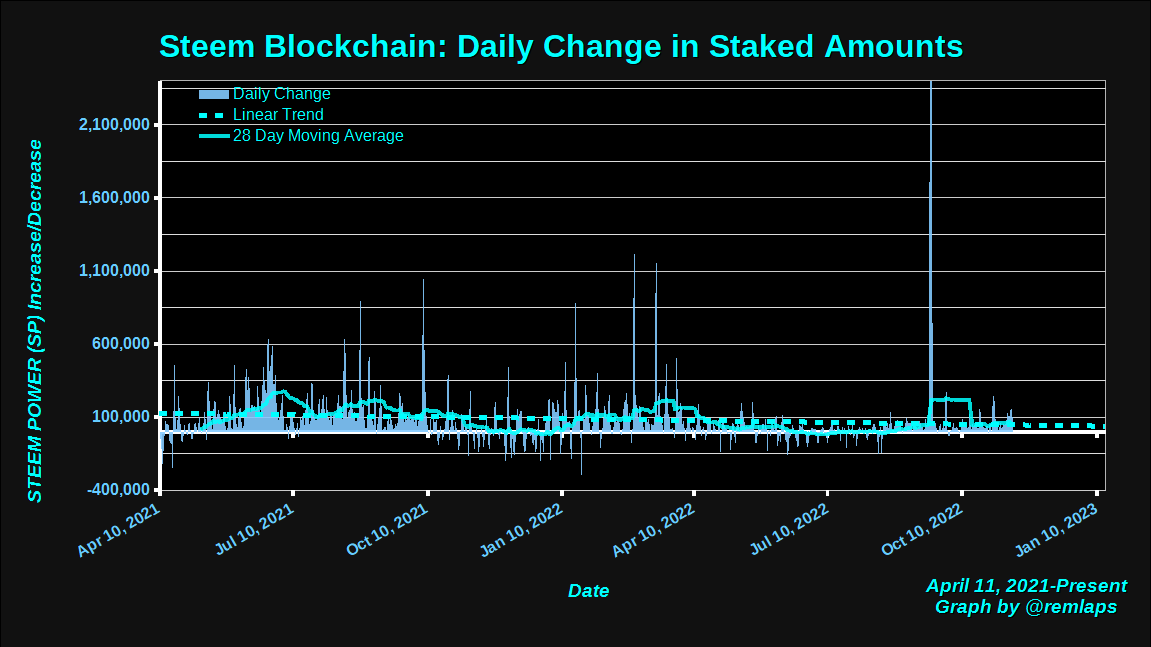
Daily Changes
Here is a chart of daily changes in powered-up STEEM from April 11, 2021 to present. The graph also includes a linear trend line and a 28 day moving average.
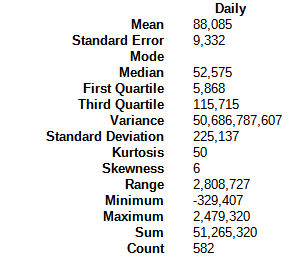
Here are some descriptive statistics, for numbers geeks.
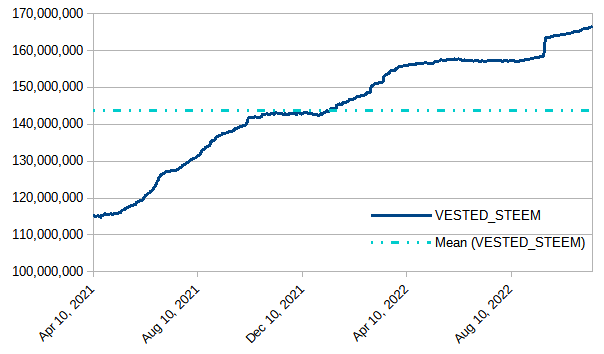
VESTED STEEM
Today's observed value was 166,660,545, which is up by ~691K, or 2/5% from last week's observed value. The graph retains a slight upslope.
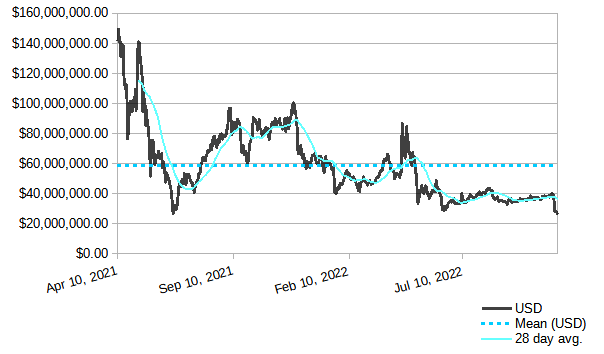
Modeled value of powered-up STEEM in terms of USD
In terms of USD, we saw a weekly decrease of about $13 million or roughly 34%. At the time of today's scheduled download, we observed an all-time low (since my tracking began) of $26,247,535.96, and it has gone down from there.
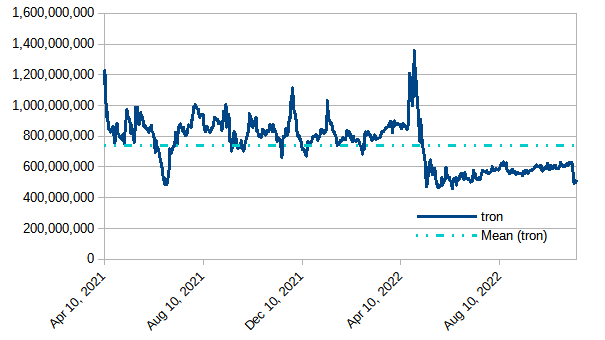
Modeled value of powered-up STEEM in terms of Tron (TRX)
Powered-up STEEM lost ground by about 105 million tokens against TRX or 17%.
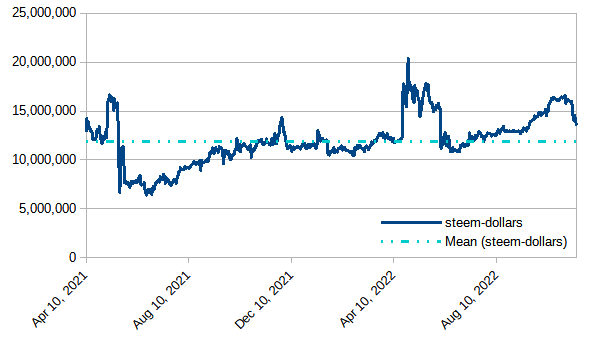
Modeled value of powered-up STEEM in terms of Steem Dollars
Down by about 2.4K SBDs or about 15%
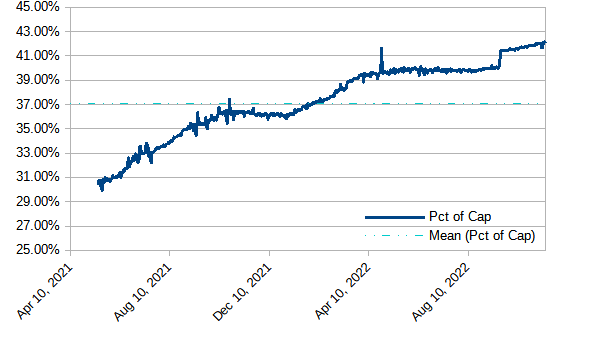
Modeled value of powered-up STEEM as a percentage of Steem's market cap
After today's observed value of 42.20% - a new high, the graph continues to show a slight upslope. We have now seen 4 consecutive days above 42%; 56 consecutive days above 41%; 223 consecutive days above 39%; 287 consecutive days above 37%; 414 consecutive days above 35%; and 477 straight days above 1/3. Will it hold above 42%?
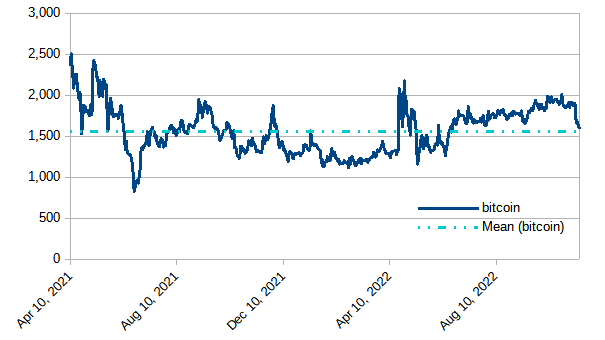
Modeled value of powered-up STEEM in terms of bitcoin (BTC)
Down by about 286 BTC, or 15% during the week.
Modeled value of powered-up STEEM in terms of Ethereum
Powered-up STEEM lost ground by about 3K ETH, or a little over 13%.

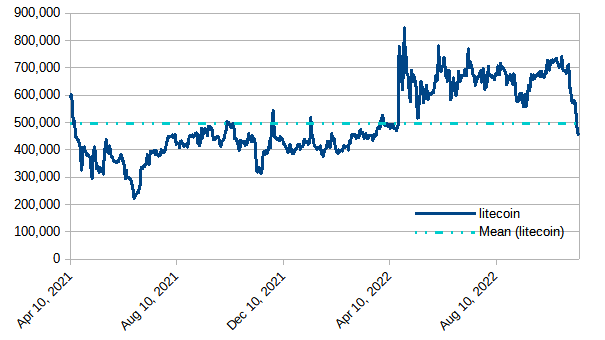
Modeled value of powered-up STEEM in terms of LTC
Powered-up STEEM lost ground by about 113K LTC, or about 20%.
Daily Powerdown Activity
Here is graph with data from steemdb.io to show daily completed and pending powerdown activity. With 401K in completed powerdowns last week and 586K pending (both measured from Monday through Sunday [GMT timezone]), we can expect powerdowns to increase next week by about 46% or less.
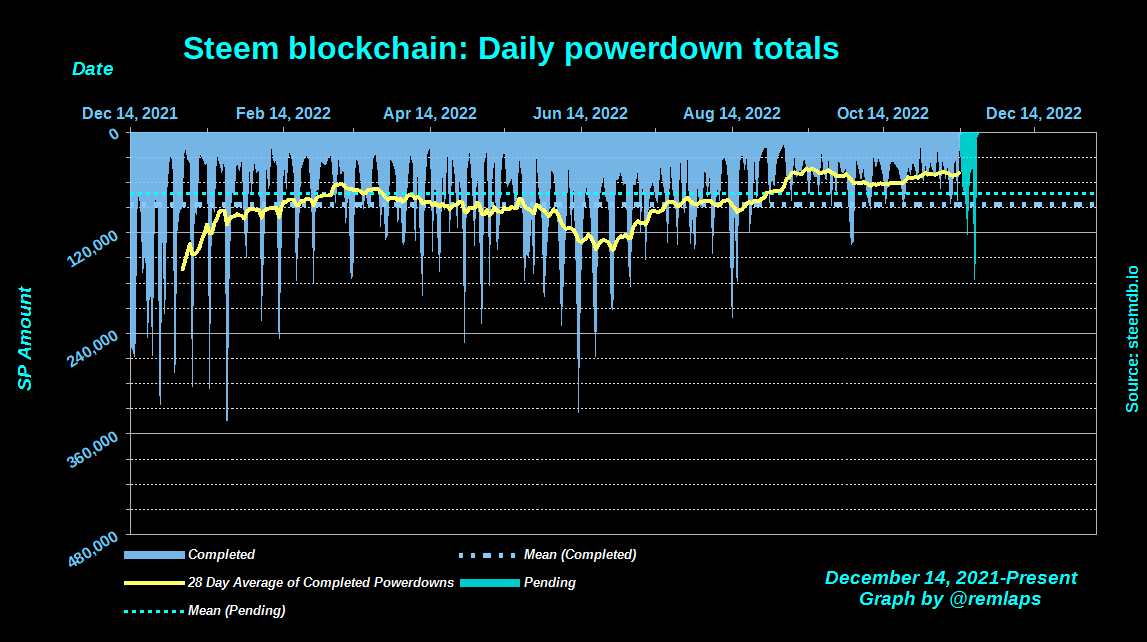
The horizontal lines are the average values for completed (blue) and pending (cyan) powerdowns, and the yellow line is a 28 day moving average of completed powerdowns. "Pending" numbers now come from the Steemit API, not from steemdb.io.
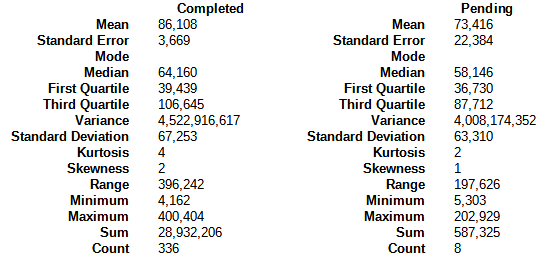
Here are some descriptive statistics for the numbers geeks
| And with a total of 1,414 pending power downs (down from 1,458 last week), here are the times, dates, and amounts of the top-10 |
|---|
1 2022-11-20T07:49:48 - 211,305,858 VESTS, 117,949 STEEM
2 2022-11-20T16:02:27 - 105,922,485 VESTS, 59,125 STEEM
3 2022-11-16T02:46:51 - 85,755,420 VESTS, 47,868 STEEM
4 2022-11-17T08:53:30 - 80,687,536 VESTS, 45,039 STEEM
5 2022-11-17T00:19:36 - 45,401,056 VESTS, 25,342 STEEM
6 2022-11-18T18:51:39 - 28,335,737 VESTS, 15,817 STEEM
7 2022-11-15T23:25:06 - 27,810,689 VESTS, 15,524 STEEM
8 2022-11-17T03:48:54 - 25,004,723 VESTS, 13,957 STEEM
9 2022-11-15T16:51:09 - 17,952,918 VESTS, 10,021 STEEM
10 2022-11-17T15:33:24 - 17,950,100 VESTS, 10,020 STEEM
Notes
- Reference prices for STEEM and other tokens are downloaded from coingecko.com
Previous posts
- Steem Total Value Powered Up - $34 million - July 3, 2022
- Steem Total Value Powered Up - $37 million - July 10, 2022
- Steem Total Value Powered Up - $36 million - July 17, 2022
- Steem Total Value Powered Up - $38 million - July 24, 2022
- Steem Total Value Powered Up - $41 million - July 31, 2022
- Steem Total Value Powered Up - $41 million - August 7, 2022
- Steem Total Value Powered Up - $43 million - August 14, 2022
- Steem Total Value Powered Up - $38 million - August 21, 2022
- Steem Total Value Powered Up - $36 million - August 28, 2022
- Steem Total Value Powered Up - $37 million - September 11, 2022
- Steem Total Value Powered Up - $36 million - September 18, 2022
- Steem Total Value Powered Up - $36 million - September 25, 2022
- Steem Total Value Powered Up - $35 million - October 2, 2022
- Steem Total Value Powered Up - $38 million - October 9, 2022
- Steem Total Value Powered Up - $37 million - October 16, 2022
- Steem Total Value Powered Up - $37 million - October 23, 2022
- Steem Total Value Powered Up - $39 million - October 30, 2022
- Steem Total Value Powered Up - $40 million - November 6, 2022
- Steem Total Value Powered Up - $24 million - November 13, 2022
For links from 2021 and the first half of 2022, see these posts:
- Steem Total Value Powered Up - $67 million - January 2,
20212022 - Steem Total Value Powered Up - $36 million - June 26, 2022
- Steem Total Value Powered Up - $36 million - June 26, 2022

Pixabay license, source
Reminder
Visit the /promoted page and #burnsteem25 to support the inflation-fighters who are helping to enable decentralized regulation of Steem token supply growth.