This is next in my series of posts reviewing the amount and value of powered up STEEM on the Steem blockchain. For previous posts, see the end of this entry.
Noteworthy in the last week |
|---|
- Week over week, the number of powered up STEEM increased by about 515K SP, or 3/10%.
- Over the course of the week, we saw seven daily increases and seven new highs in the number of staked STEEM. The current streak of consecutive new highs stands at nine.
- The modeled value lost ground against all comparison values except for USD and BTC. Changes ranged from -2.13% against LTC to +0.28%% against USD.
- In terms of all comparison values except for TRX and USD, the modeled value remains above its January 1 baseline.
- In terms of all comparison tokens except TRX and USD, the modeled value is above its long term average.
- This week (Sunday through Saturday) saw a total of 357K STEEM powered down, which is a decline of about 6% as compared to last week's 381K STEEM.
Here are the numbers as-of a few minutes ago |
|---|
Total value locked in powered-up STEEM (USD): $37,316,085.10
STEEM market cap $89,343,632.93
Locked value in terms of other tokens:
| token | price | locked value equivalent | Jan 1, 2022 | pct of Jan 1 baseline |
|---|---|---|---|---|
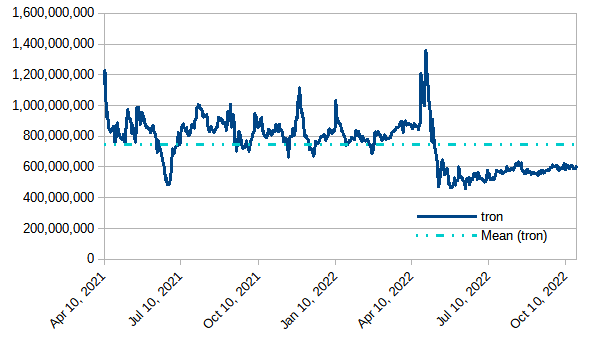
| tron | $0.06 | 606,588,073 | 809,173,538 | 74.96% |
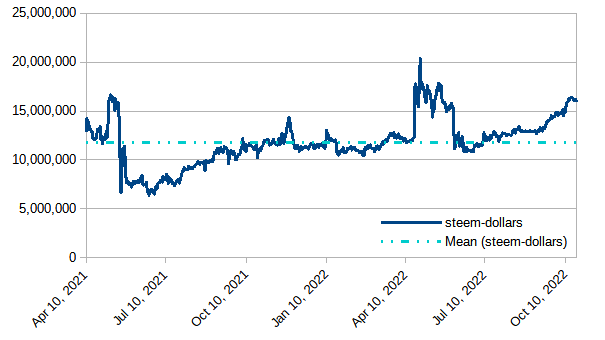
| steem-dollars | $2.30 | 16,224,384 | 11,284,131 | 143.78% |
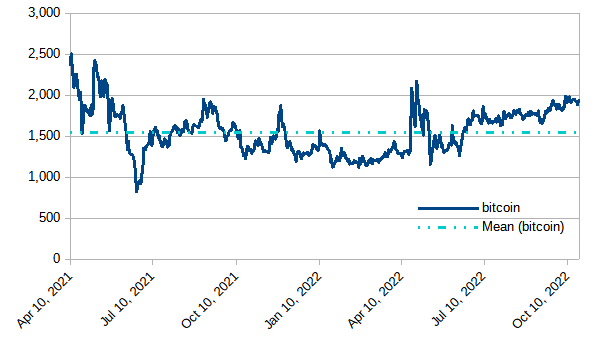
| bitcoin | $19,189.50 | 1,944 | 1,300 | 149.58% |
| ethereum | $1,313.79 | 28,403 | 16,501 | 172.13% |
| litecoin | $52.30 | 713,500 | 411,561 | 173.36% |
| steem | $0.23 | 165,125,650 | 142,930,214 | 115.53% |
| USD | $1.00 | 37,316,085 | 61,837,042 | 60.35% |
|
|---|
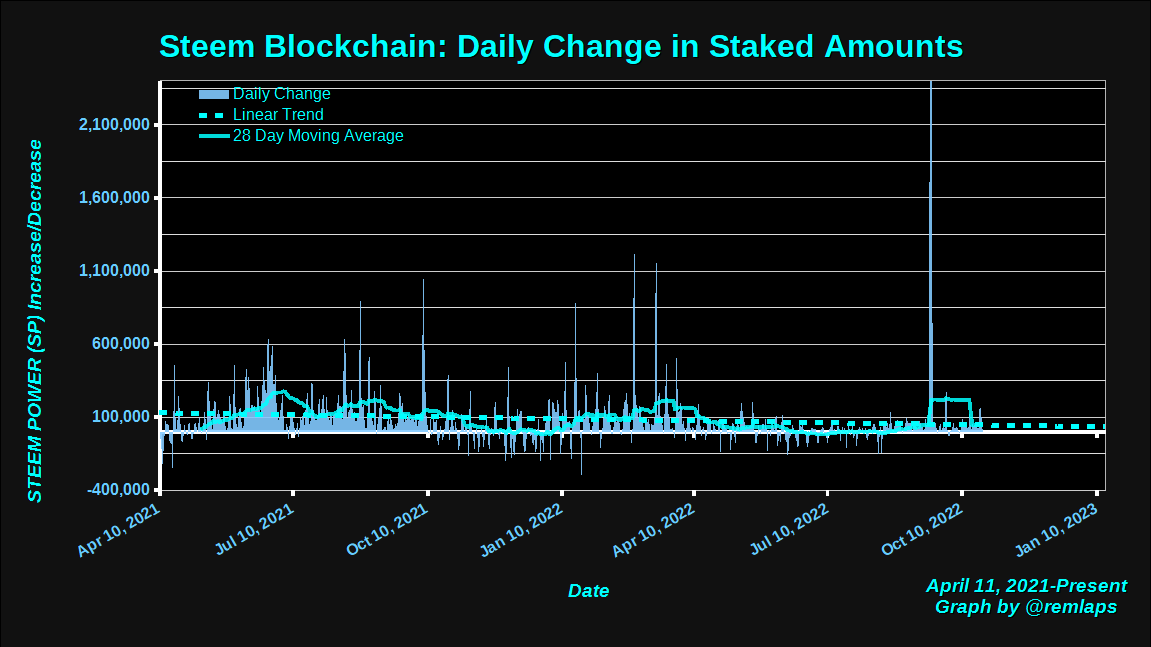
Daily Changes
Here is a chart of daily changes in powered-up STEEM from April 11, 2021 to present. The graph also includes a linear trend line and a 28 day moving average.
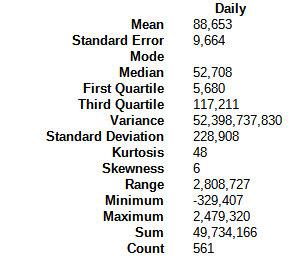
Here are some descriptive statistics, for numbers geeks.
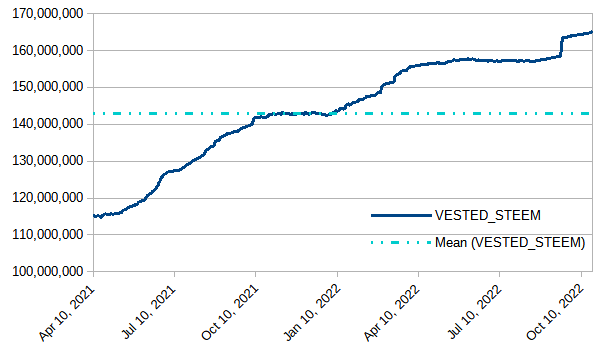
VESTED STEEM
Today's observed value was 165,129,391, which is up by ~515K, or 3/10% from last week's observed value. The graph retains a slightly perceptible upslope.
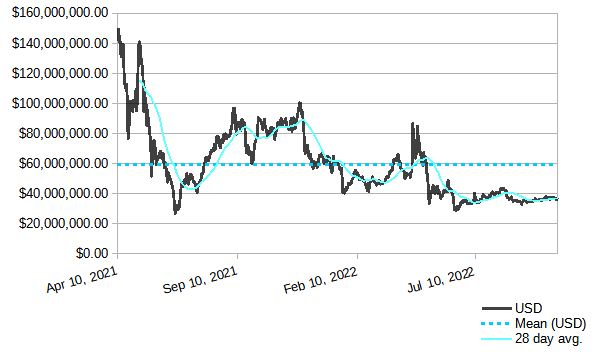
Modeled value of powered-up STEEM in terms of USD
In terms of USD, we saw a weekly increase of about $100K or roughly 1/4%. The value is still below the long-term mean, and holds above its recent low near $34 million. It also remains above the low of ~27 million from June 22, 2021.
Modeled value of powered-up STEEM in terms of Tron (TRX)
Powered-up STEEM lost ground by about 100 thousand tokens against TRX or about 1/50%.
Modeled value of powered-up STEEM in terms of Steem Dollars
Down by almost 450K SBDs or a nearly 2 3/4%
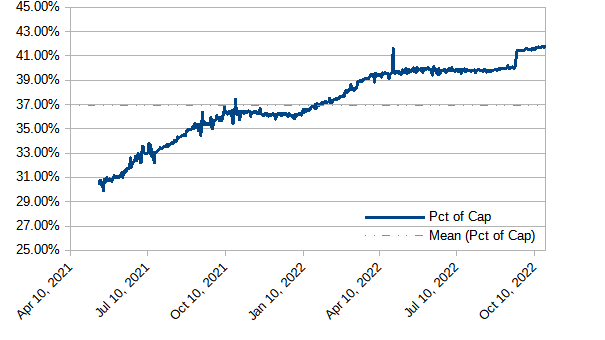
Modeled value of powered-up STEEM as a percentage of Steem's market cap
After today's observed value of 41.75%, the graph continues to show a slight upslope. We also saw a new high of 31.80% on October 19 (Wednesday). We have now seen 35 consecutive days above 41%; 202 consecutive days above 39%; 266 consecutive days above 37%; 393 consecutive days above 35%; and 456 straight days above 1/3. Will it hold above 41%? Will it climb above 42%
Modeled value of powered-up STEEM in terms of bitcoin (BTC)
Up by about 2 BTC, or 1/10% during the week.
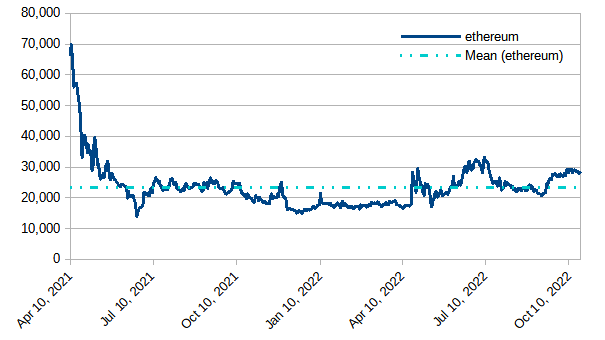
Modeled value of powered-up STEEM in terms of Ethereum
Powered-up STEEM lost ground by roughly 525 ETH, or a little under 2%.
Modeled value of powered-up STEEM in terms of LTC
Lost ground by about 15K, or a bit over 2%.
Daily Powerdown Activity
Here is graph with data from steemdb.io to show daily completed and pending powerdown activity. With 357K in completed powerdowns last week and 373K pending (both measured from Sunday through Saturday), we can expect powerdowns to increase next week by about 4% or less.
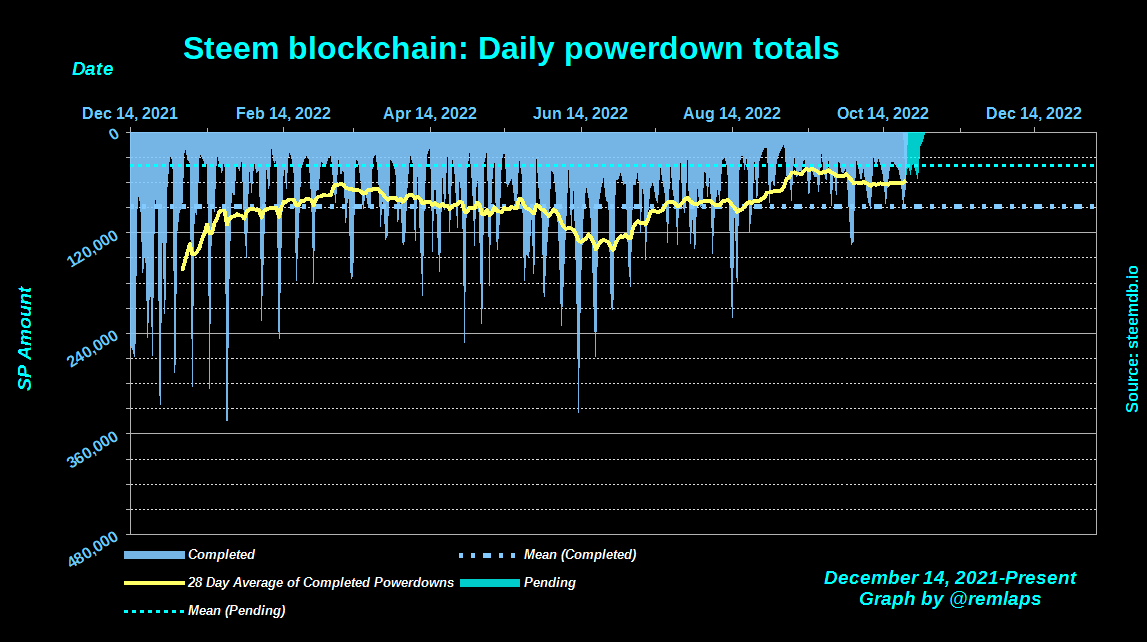
The horizontal lines are the average values for completed (blue) and pending (cyan) powerdowns, and the yellow line is a 28 day moving average of completed powerdowns. "Pending" numbers now come from the Steemit API, not from steemdb.io.
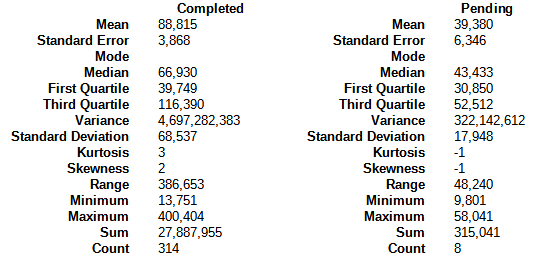
Here are some descriptive statistics for the numbers geeks
| And with a total of 1,392 pending power downs (up from 1,233 last week), here are the times, dates, and amounts of the top-10 |
|---|
1 2022-10-23T16:02:15 - 84,307,551 MVESTS, 46,979 STEEM
2 2022-10-25T12:51:48 - 29,427,358 MVESTS, 16,398 STEEM
3 2022-10-28T11:11:21 - 21,324,320 MVESTS, 11,883 STEEM
4 2022-10-25T16:51:09 - 17,952,918 MVESTS, 10,004 STEEM
5 2022-10-27T15:33:24 - 17,950,100 MVESTS, 10,002 STEEM
6 2022-10-28T11:10:57 - 16,897,684 MVESTS, 9,416 STEEM
7 2022-10-28T16:15:57 - 13,071,148 MVESTS, 7,284 STEEM
8 2022-10-27T19:47:09 - 8,499,529 MVESTS, 4,736 STEEM
9 2022-10-23T15:32:48 - 7,213,137 MVESTS, 4,019 STEEM
10 2022-10-27T21:22:33 - 6,845,010 MVESTS, 3,814 STEEM
Notes
- Reference prices for STEEM and other tokens are downloaded from coingecko.com
Previous posts
- Steem Total Value Powered Up - $34 million - July 3, 2022
- Steem Total Value Powered Up - $37 million - July 10, 2022
- Steem Total Value Powered Up - $36 million - July 17, 2022
- Steem Total Value Powered Up - $38 million - July 24, 2022
- Steem Total Value Powered Up - $41 million - July 31, 2022
- Steem Total Value Powered Up - $41 million - August 7, 2022
- Steem Total Value Powered Up - $43 million - August 14, 2022
- Steem Total Value Powered Up - $38 million - August 21, 2022
- Steem Total Value Powered Up - $36 million - August 28, 2022
- Steem Total Value Powered Up - $37 million - September 11, 2022
- Steem Total Value Powered Up - $36 million - September 18, 2022
- Steem Total Value Powered Up - $36 million - September 25, 2022
- Steem Total Value Powered Up - $35 million - October 2, 2022
- Steem Total Value Powered Up - $38 million - October 9, 2022
- Steem Total Value Powered Up - $37 million - October 16, 2022
- Steem Total Value Powered Up - $37 million - October 23, 2022
For links from 2021 and the first half of 2022, see these posts:
- Steem Total Value Powered Up - $67 million - January 2,
20212022 - Steem Total Value Powered Up - $36 million - June 26, 2022
- Steem Total Value Powered Up - $36 million - June 26, 2022

Pixabay license, source
Reminder
Visit the /promoted page and #burnsteem25 to support the inflation-fighters who are helping to enable decentralized regulation of Steem token supply growth.