
OK my pride of lions, I think it's time for me to give you a visual as to what is occurring in the bond/debt market, and the current flattening yield curve.
First allow me define for you what it means to have a flattening yield curve, and why it's important.
A Flattening of the yield curve is a situation that describes the relationship between short and long-term bonds (debt).
Generally a 30 year bond would have a greater yield then let's say a 10 year bond. The higher yield is offered to the investor because of the risk associated with holding a Long term debt instrument.
All the talk, even from the mainstream financial media about the current flattening yield curve comes down to this: it indicates that there is growing concern among investors regarding the longer-term macro economic outlook-it is just that simple.
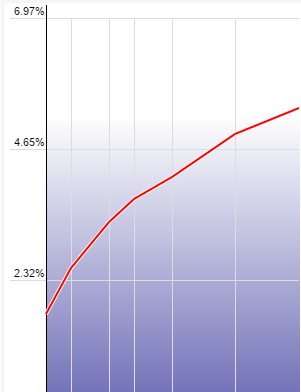
Have a look at this first chart below.
This is an example of what a normal yield curve looks like, this particular chart is from 2004.
Now have a look at this other chart below.
This is our current yield curve. Notice anything?
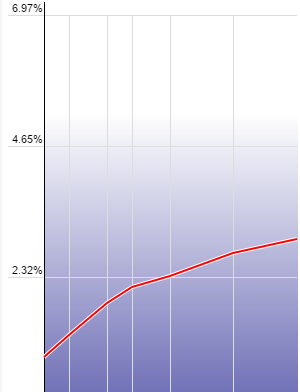
What this says to me, and should say to you as well, is the longer-term macro economic outlook is not as blissful as the mainstream financial Pundits would like you to believe.
Well seeing is believing, and after getting a visual on the differences between a normal yield curve and our current situation, what do you think about this?
Gregory Mannarino