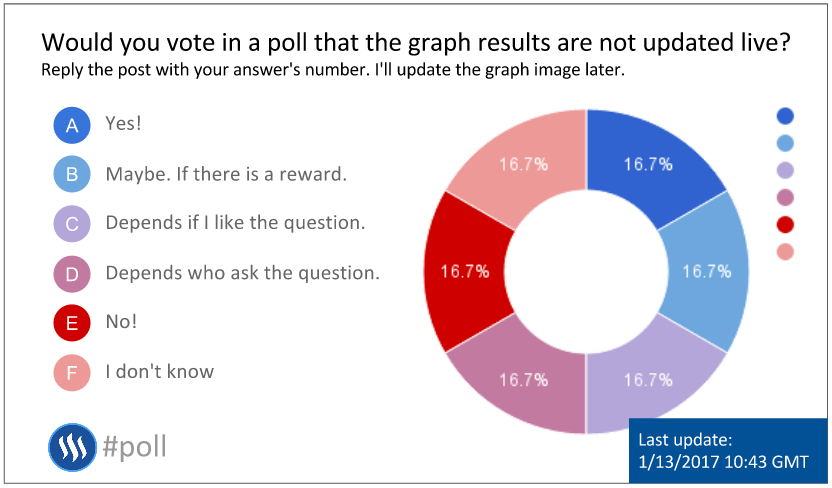
Hi steemians? I decided to test this format of posting polls and simultaneously showing graph results (not in real time), if you have time please reply this post with the letter (A to F) corresponding your vote.
Then I intend to count the replies and update the graph image from time to time.
If you liked the idea and want to make a test yourself, I shared the graph image and spreadsheet templates in Google Drive, so you can copy and edit with your Google account (Gmail). The graph image on Google Slides are linked to the data on Google Spreadsheets, please make copies of both before doing your customization. After that, you should delete the linked graph in the Slides template and insert the copied spreadsheet you made (click and drag to resize and double click to crop the image).
Thanks in advance and good luck for us all!
Suggested posts:
1/13/2017 - @blockchaincat: Catched in a Pokeball?
1/11/2017 - @steemcenterwiki: New wiki page created: Steem and Steemit in the news
1/4/2017 - How my dog became famous on the internet because this picture of a pet bed made with recycled Mac monitor
1/2/2017 - Happy new years - I see steem everywhere!
12/26/2016 - Steemit Knots, an idea of places to share subject specific, group created content on Steemit
12/13/2016 - An easy and simple way to help spread Steemit on Twitter
Log on Steemit and take rewards for your content too >>>
