
SUMMARY
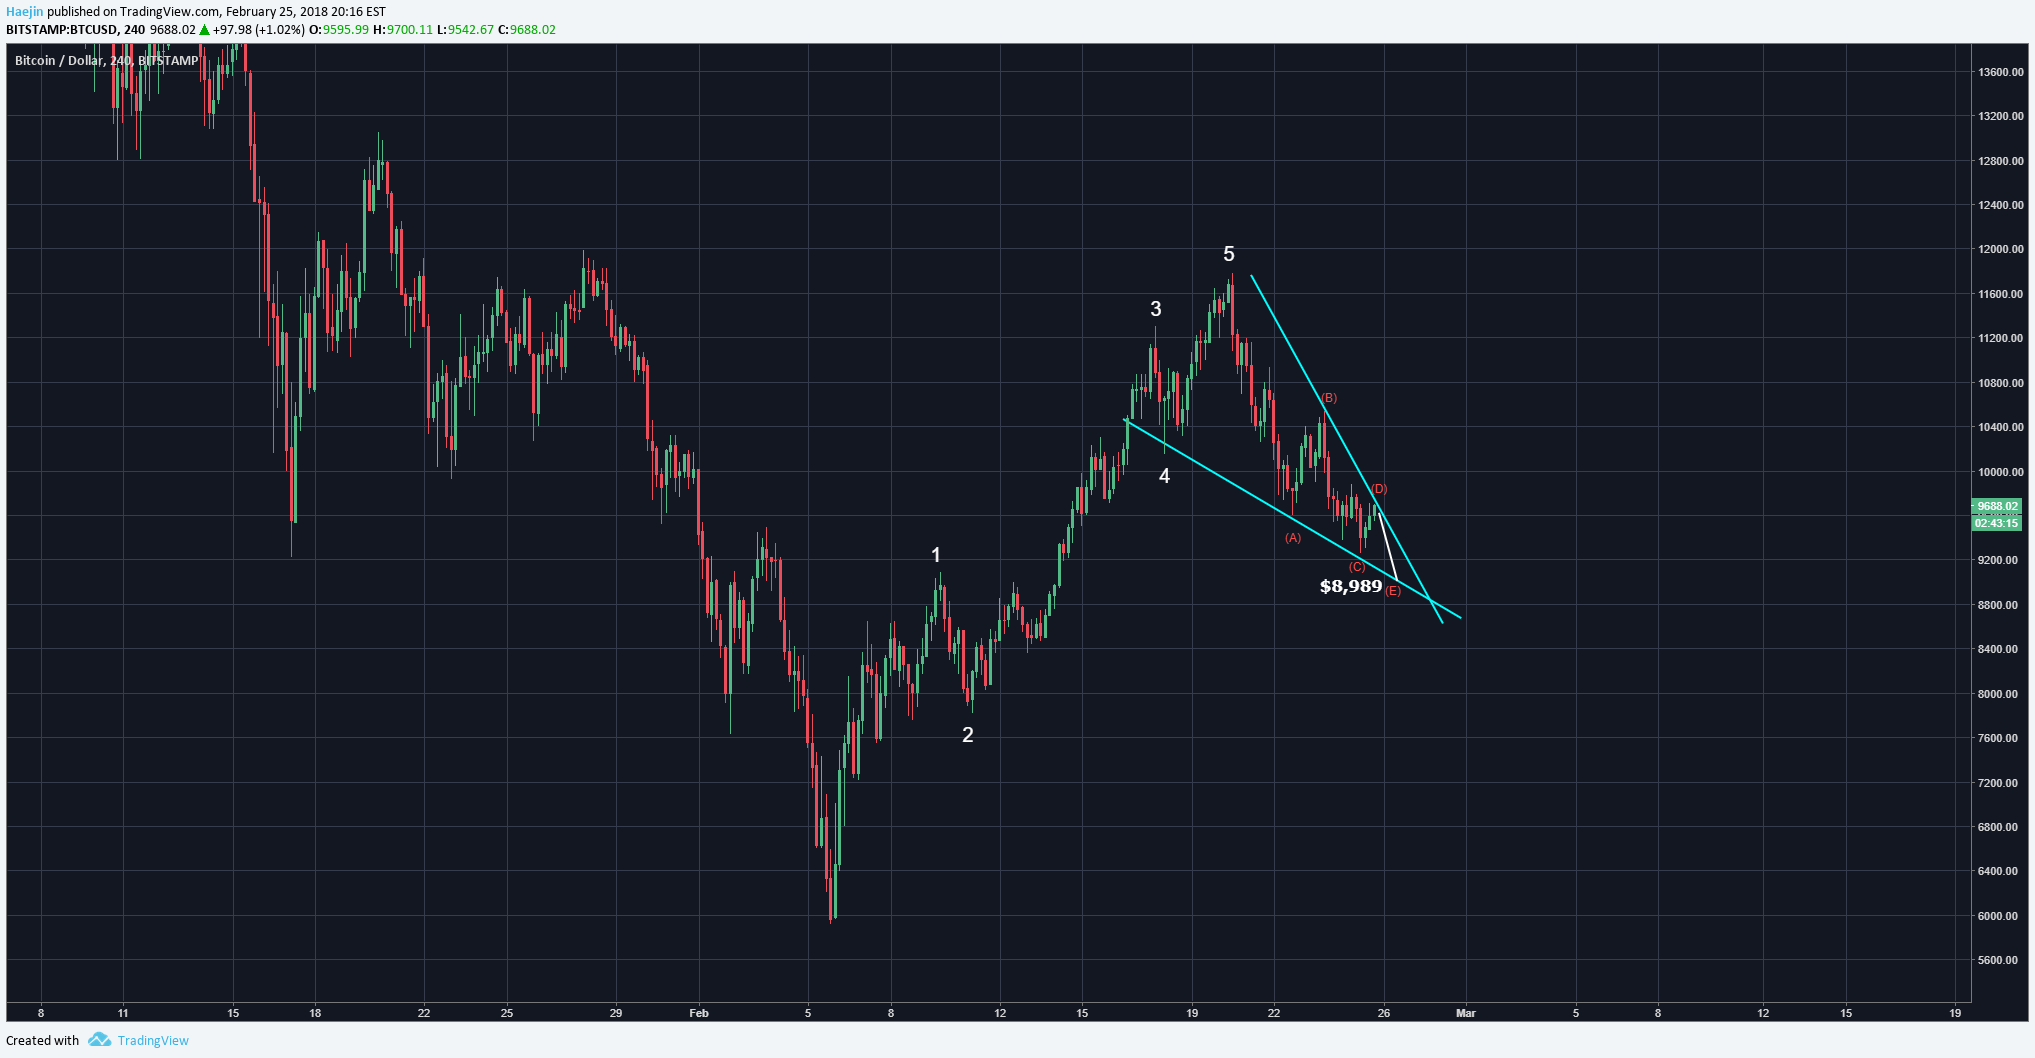
The below wedge chart is looking more and more primary on the shorter degree of trend. I've labeled abcd as being complete and e is likley next to perhaps $8,989 or so. Bear in mind, that not every triangle needs to display abcde; four are also not that uncommon. In other words, price can breakout at d and not complete the e wave.

The wedge fits well into a 0.618 Fib correction following a five wave impulse up (white).
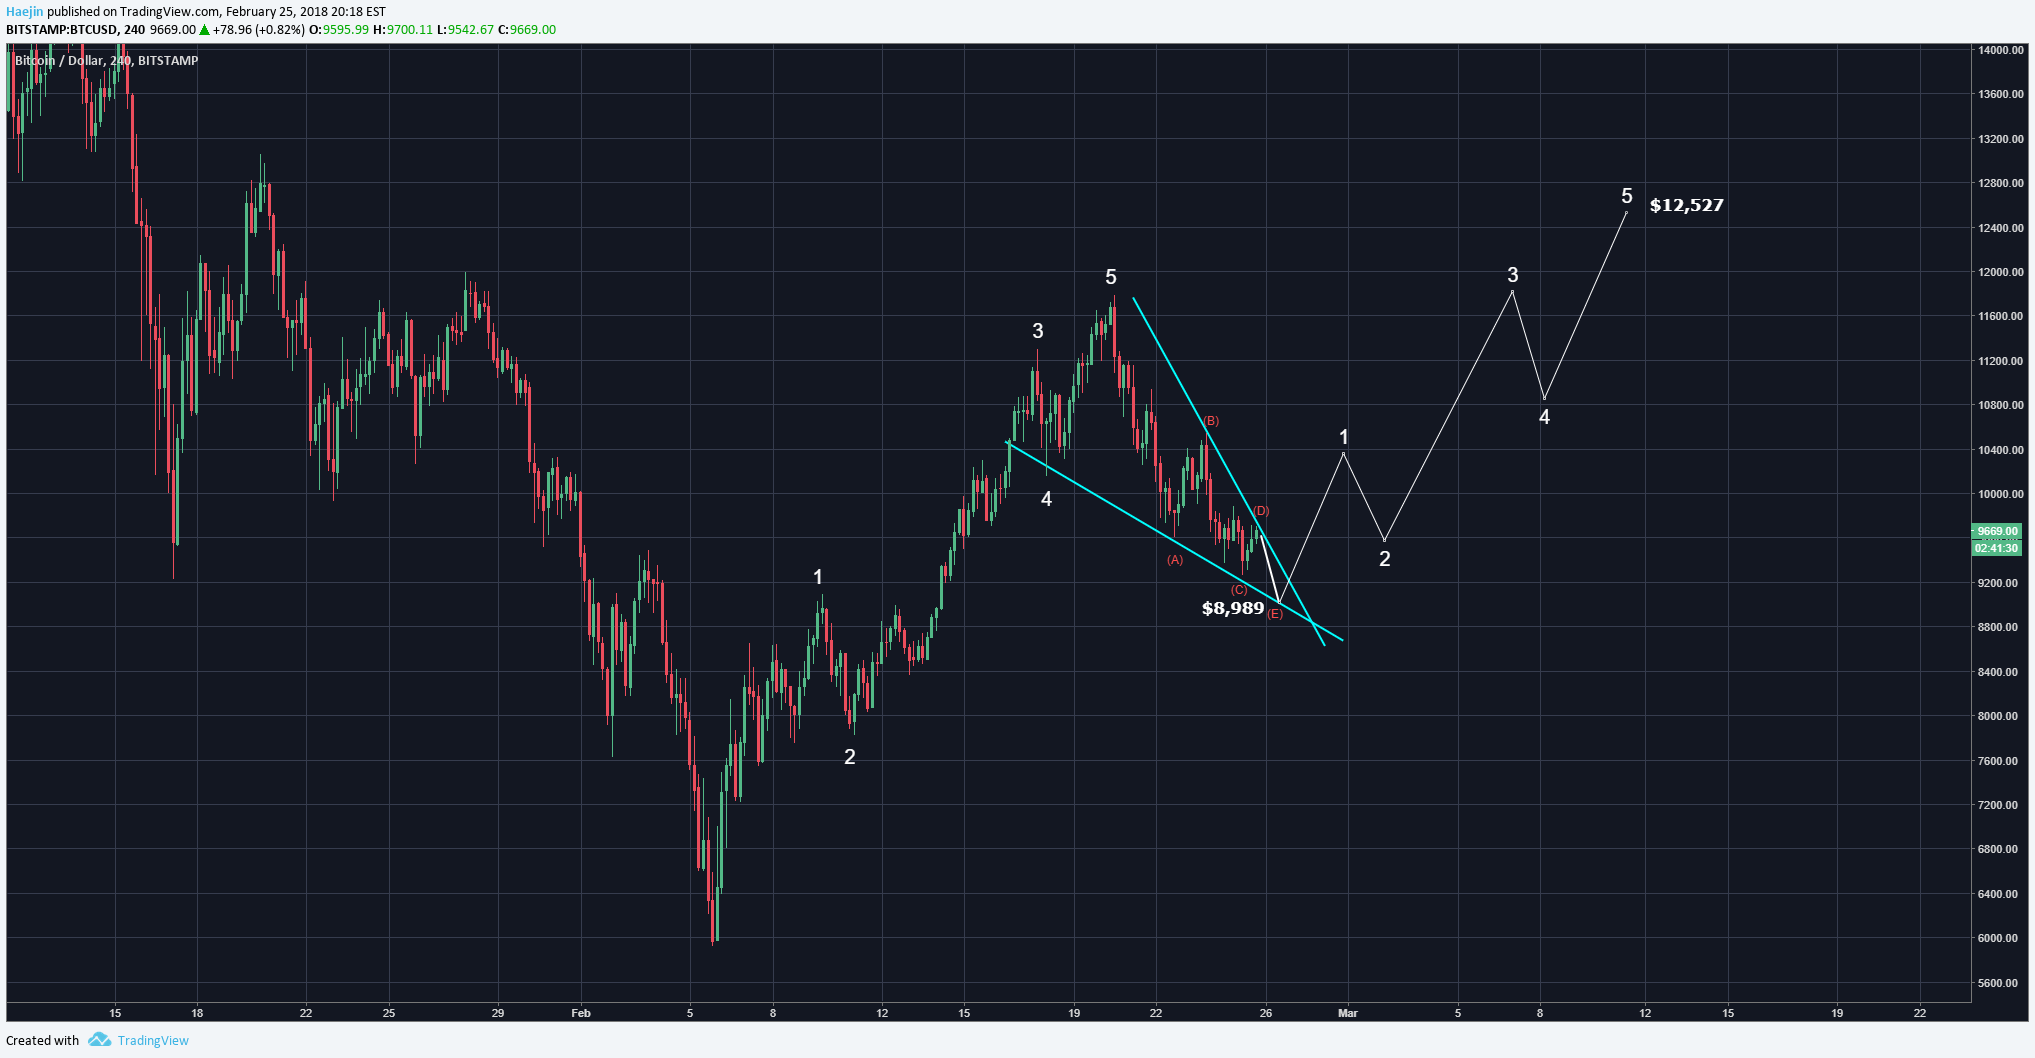
IF the wedge pattern completes and confirms, I've added the likely impulse waves and instead of using a cooky cutter Fib chart, I use native Fib zones; a secret sauce of mine. This pathway provides how the needed higher high can be attained. IF $12,527 is hit, the Inverted Head & Shoulders could also be considered confirmed! Let's see how the overnight price action plays out.
Legal Disclaimer: I am not a financial advisor nor is any content in this article presented as financial advice. The information provided in this blog post and any other posts that I make and any accompanying material is for informational purposes only. It should not be considered financial or investment advice of any kind. One should consult with a financial or investment professional to determine what may be best for your individual needs. Plain English: This is only my opinion, make of it what you wish. What does this mean? It means it's not advice nor recommendation to either buy or sell anything! It's only meant for use as informative or entertainment purposes.
Please consider reviewing these Tutorials on:
Elliott Wave Counting Tutorial #1
Elliott Wave Counting Tutorial #2
Elliott Wave Counting Tutorial #3
Laddering and Buy/Sell Setups.
Laddering Example with EOS
Tutorial on the use of Fibonacci & Elliott Waves
@haejin's Trading Nuggets
Essay: Is Technical Analysis a Quantum Event?
Follow me on Twitter for Real Time Alerts!!
Follow me on StockTwits for UpDates!!
--
--