SUMMARY
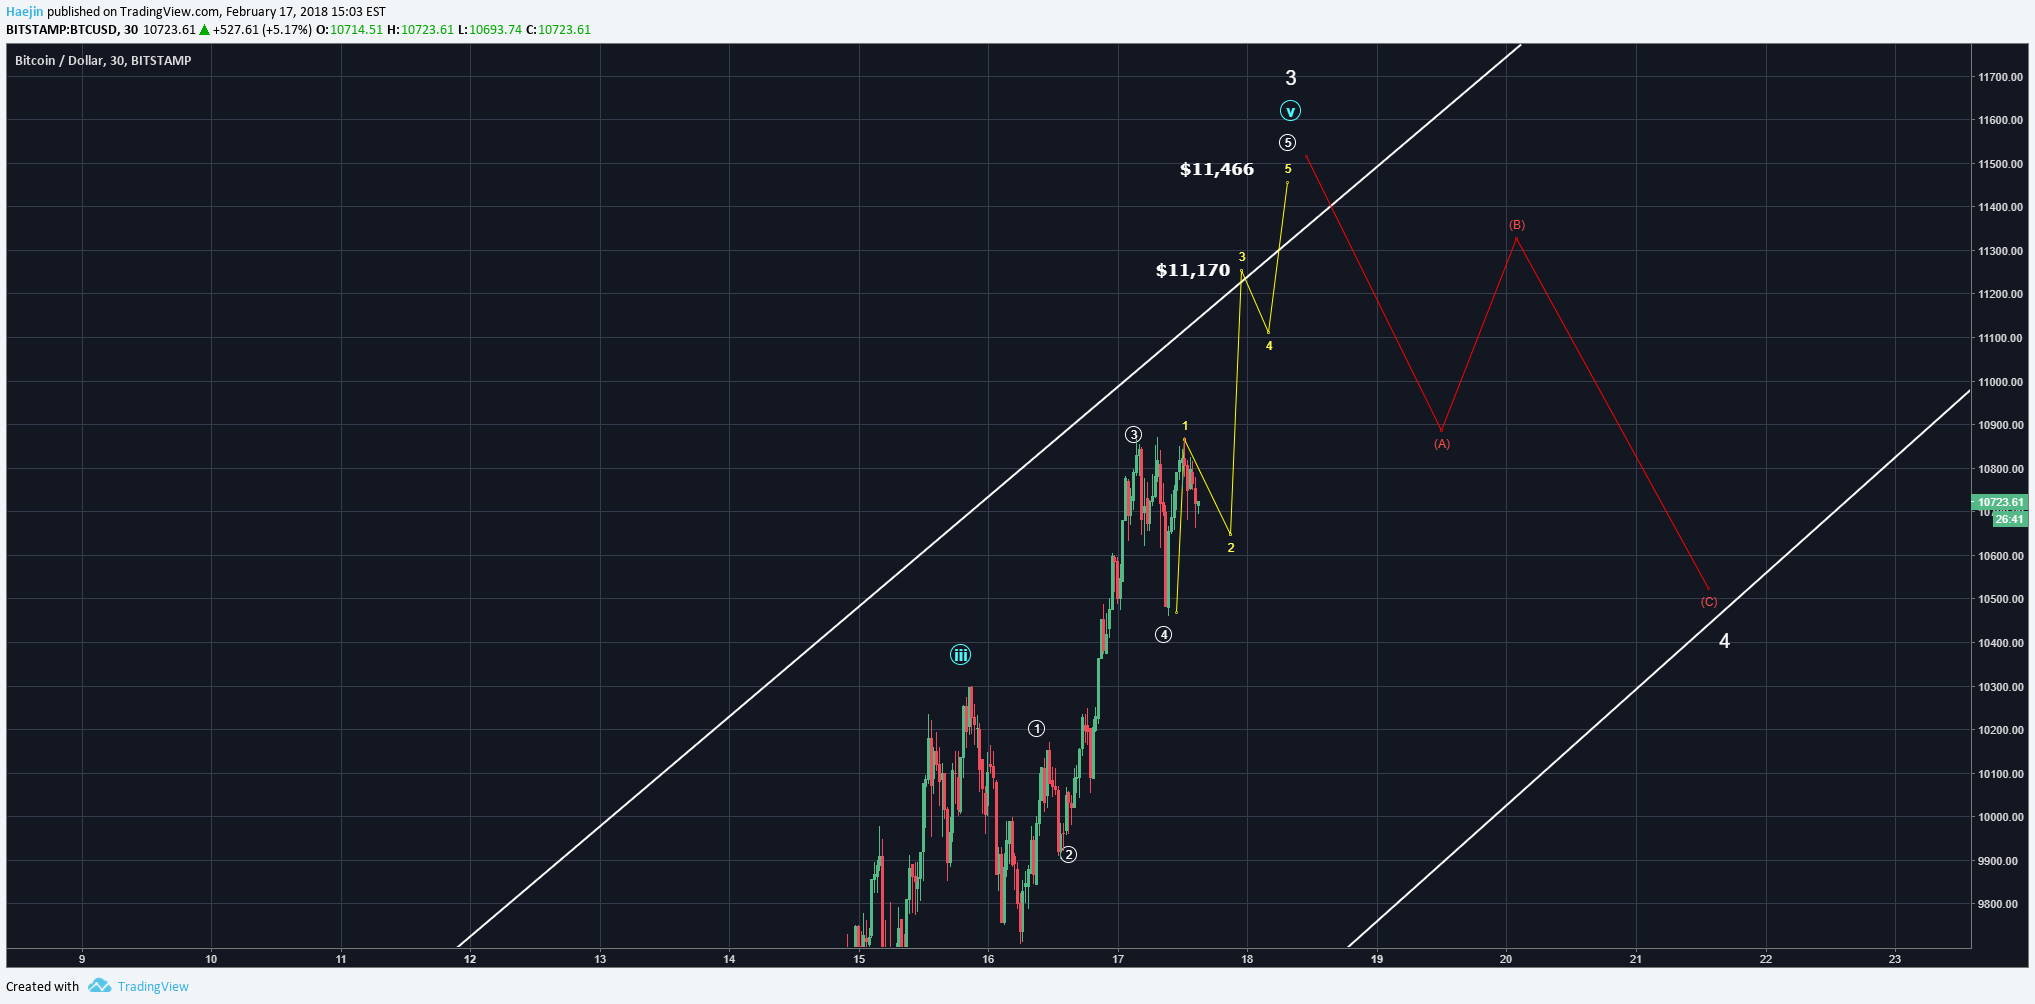
Bitcoin (BTC) had completed and confirmed a smaller degree Inverted, Bullish Head & Shoulders and this has been shown extensivel in past posts. Price has matured now such that the higher degree of trend H&S Bull pattern is in the progress of getting completed. The blue line projects a rough pathway outline on how the Right Shoulder could complete. Recall, that a pattern requires completion and a confirmation. That confirmation would be in the form of price breaching higher and above the horizontal blue Neck Line. It would be quite exciting to see this in action; perhaps in the next few days! The volume confirmation is also following quite well. The completiong of impulse wave 3,4 and 5 could fit well into the start of RS of the pattern.

Zooming into the miniscule level of price waves, I've raised the top of wave 3 of V (blue) of circled 5 of yellow 5 from $11,170 to $11,466 or so. Usually, price briefly pierces the upper line of the channel prior to coming back inside and declining in a corrective manners as shown by the ABC red waves. These ABCs should match well with the endpoint of wave 4.
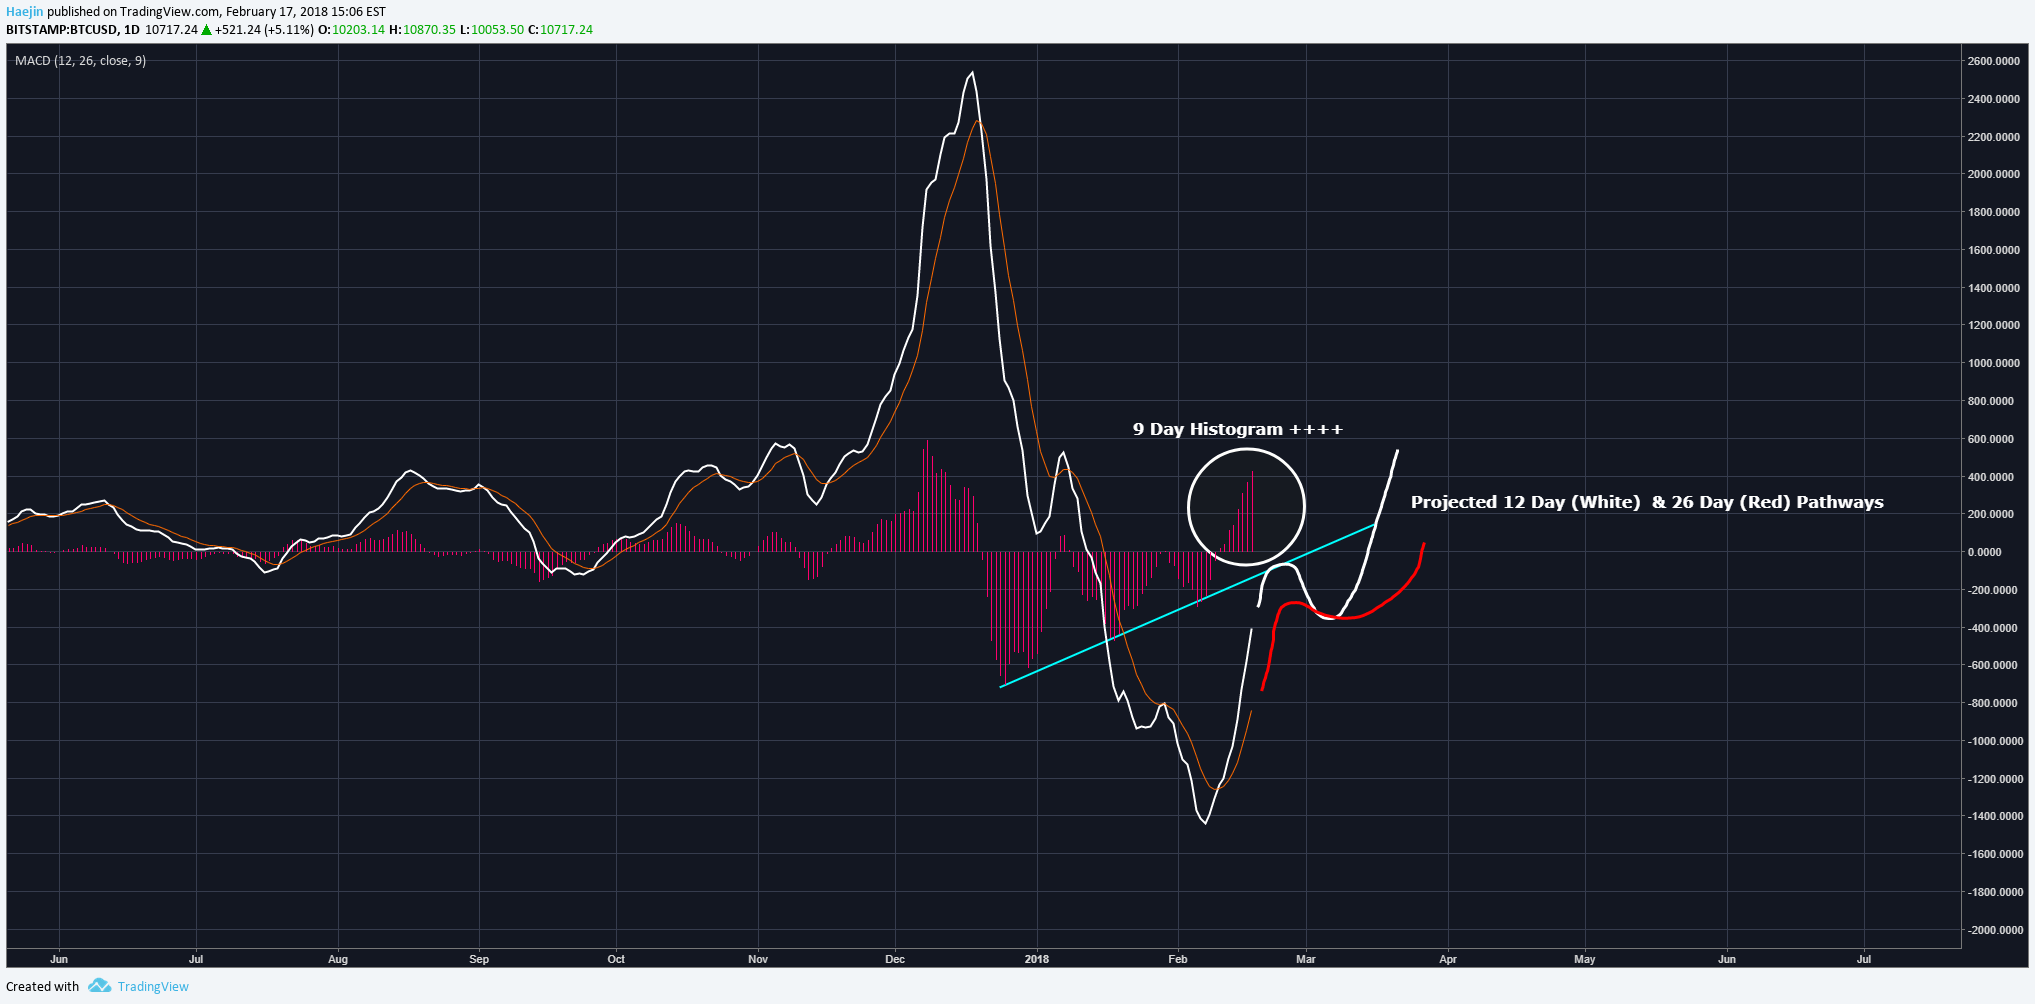
What I find quite exciting is the daily scale MACD! Note how the 9 day histogram (my early indicator) is very well into the positive territory (above the o.oo level). Almost 70% of the time, the 12 day indicator follows into the positive territory. That means there could be alot more of upside to come. I've drawn out a rough projection of the 12 day (white) and 26 day (red) pathways.
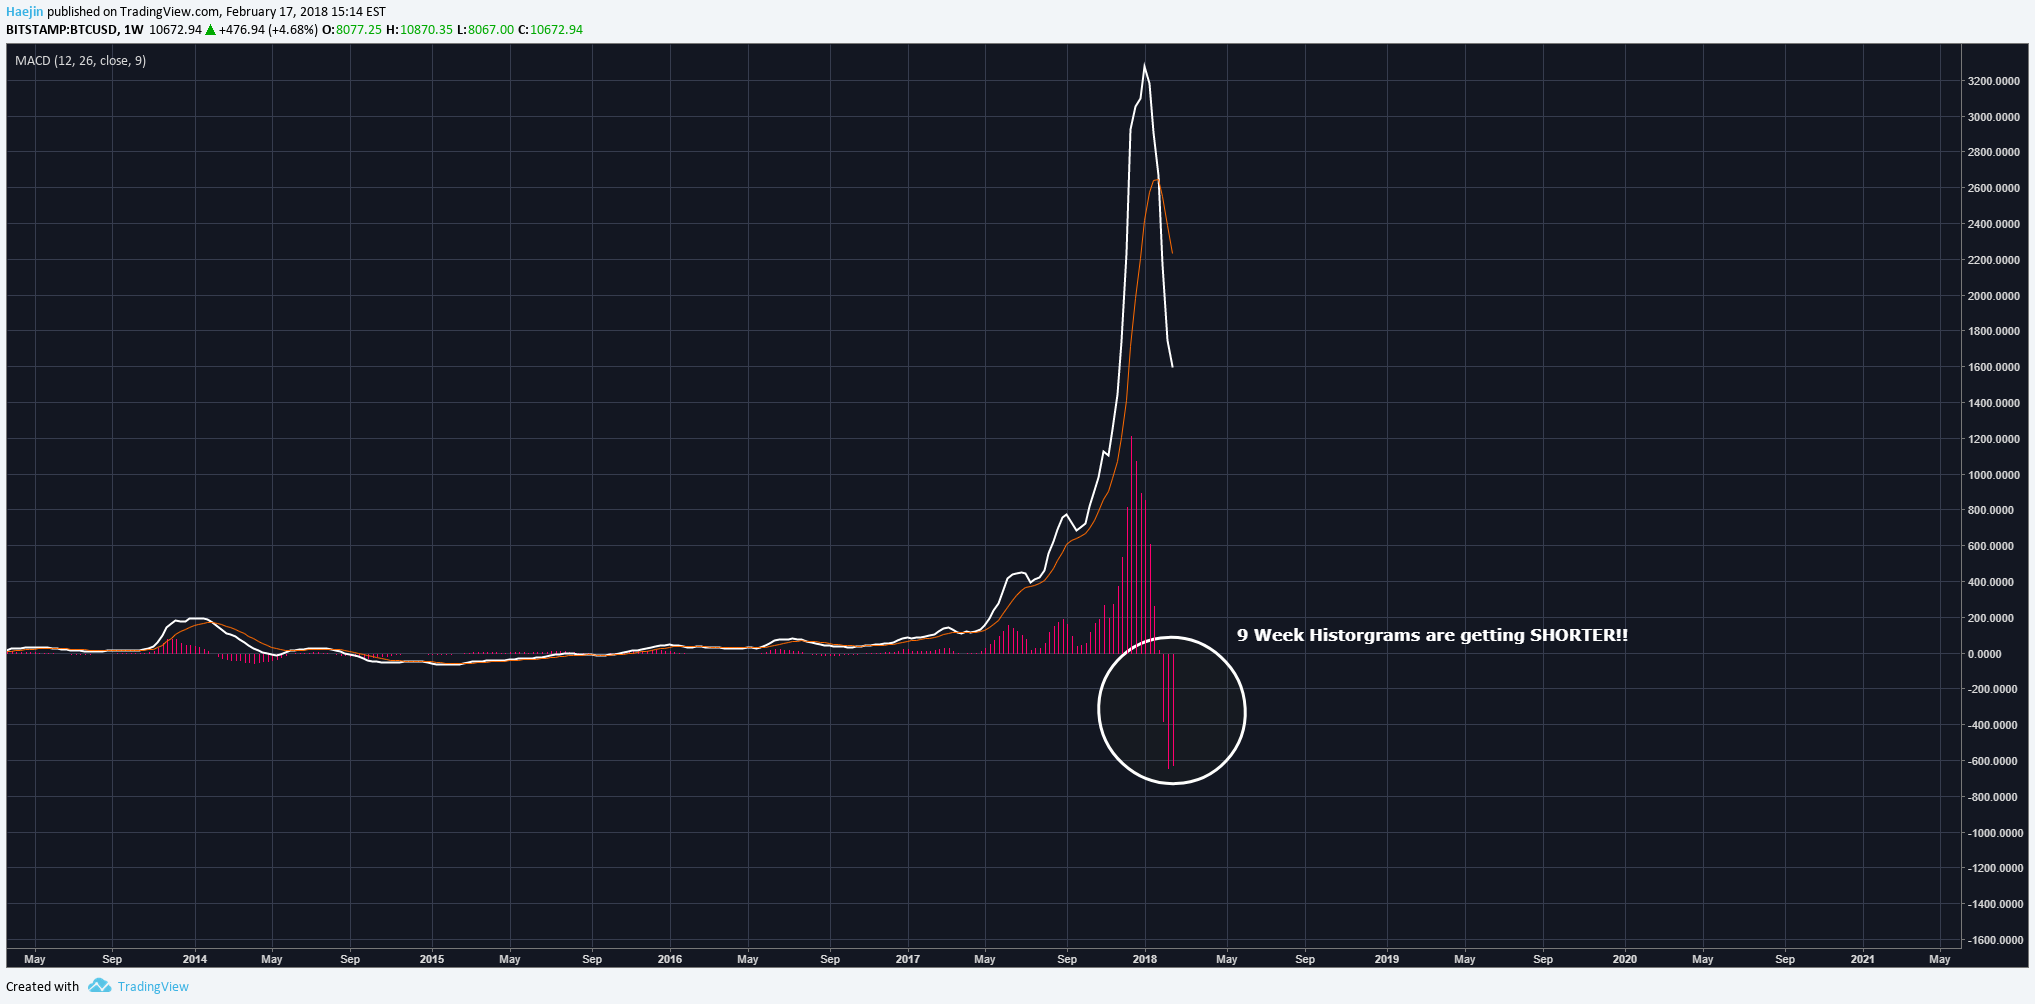
Here is the weekly MACD. I most favor the MACD because it's like having three indicators in one. The earliest warning system, the 9 week histogram moves and turns first ahead of the 12 and 26 week. Tis means that the histogram length is getting shorter and so the earliest signs of a turn at the weekly degree of trend is now showing. What does mean? A very nice trend reversal or the resumption of the original trend.
Legal Disclaimer: I am not a financial advisor nor is any content in this article presented as financial advice. The information provided in this blog post and any other posts that I make and any accompanying material is for informational purposes only. It shoud not be considered financial or investment advice of any kind. One should consult with a financial or investment professional to determine what may be best for your individual needs. Plain English: This is only my opinion, make of it what you wish. What does this mean? It means it's not advice nor recommendation to either buy or sell anything! It's only meant for use as informative or entertainment purposes.
Please consider reviewing these Tutorials on:
Elliott Wave Counting Tutorial #1
Elliott Wave Counting Tutorial #2
Elliott Wave Counting Tutorial #3
Laddering and Buy/Sell Setups.
Laddering Example with EOS
Tutorial on the use of Fibonacci & Elliott Waves
@haejin's Trading Nuggets
Essay: Is Technical Analysis a Quantum Event?
Follow me on Twitter for Real Time Alerts!!
Follow me on StockTwits for UpDates!!
--
--