
SUMMARY
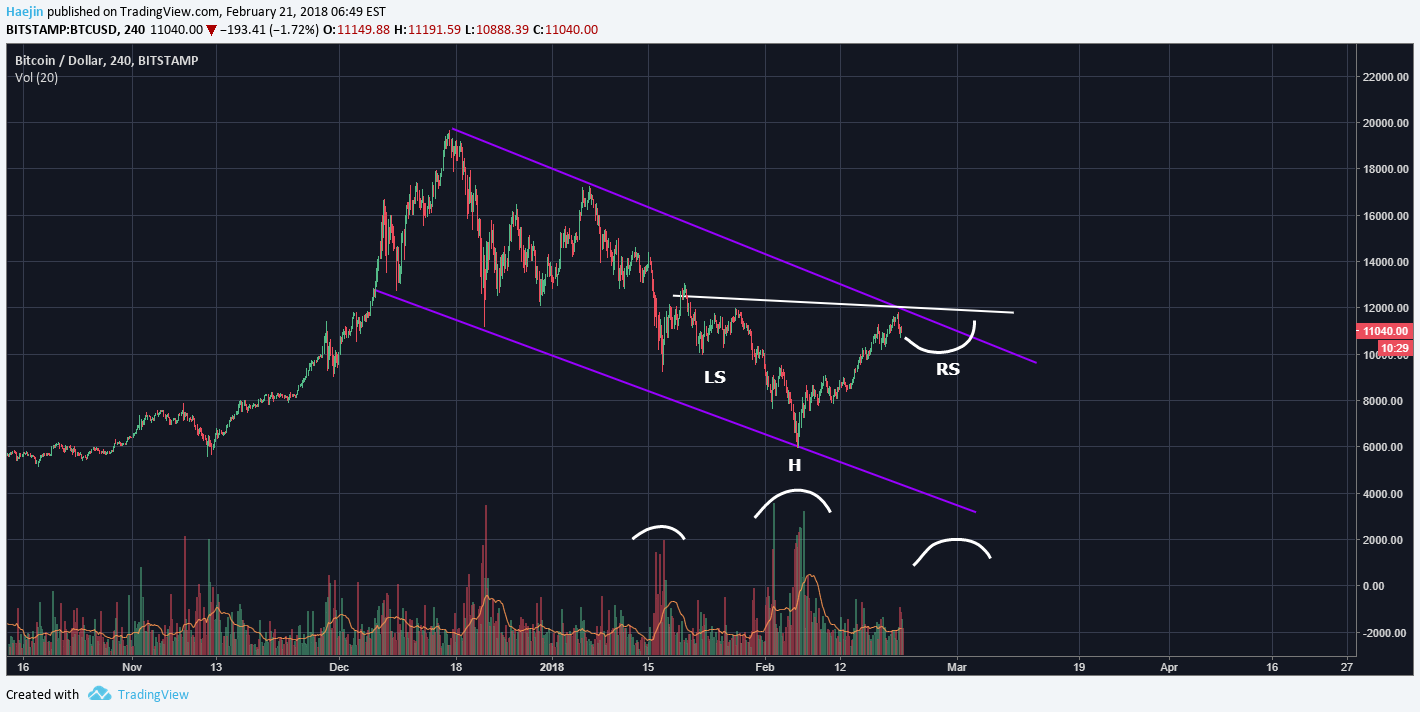
BTC is still at the CRITICAL JUNCTURE. Still, the below remains my primary count and I've shown this pattern for over a week so no real chage; only high alert sensing. Eventhough we are at a critical junction, the below Inverted Head & Shoulders bullish pattern is expected to occur. This pattern would provide the mojo for Bitcoin to well exceed the upper trend line.
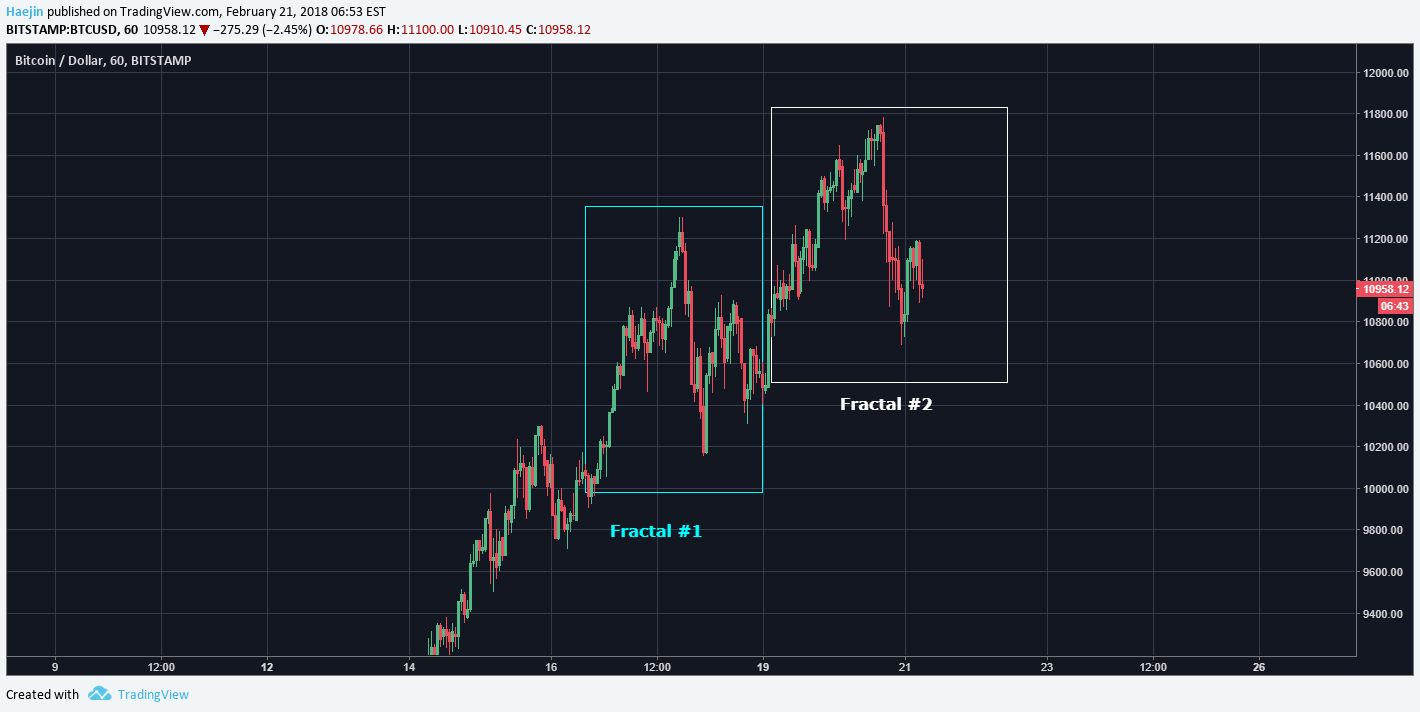
Watching the behavior of Bitcoin price in shorter time frame, the below pair of fractals was noticeable. Note how on Fractal #1 (blue box), the initial decline was followed by a 62% rebound and then a smaller decline for a higher low prior to exceeding prior peak. Now, the white box shows Fractal #2 as having completed the initial decline from the peak and is in the process of shaping out the rebound.
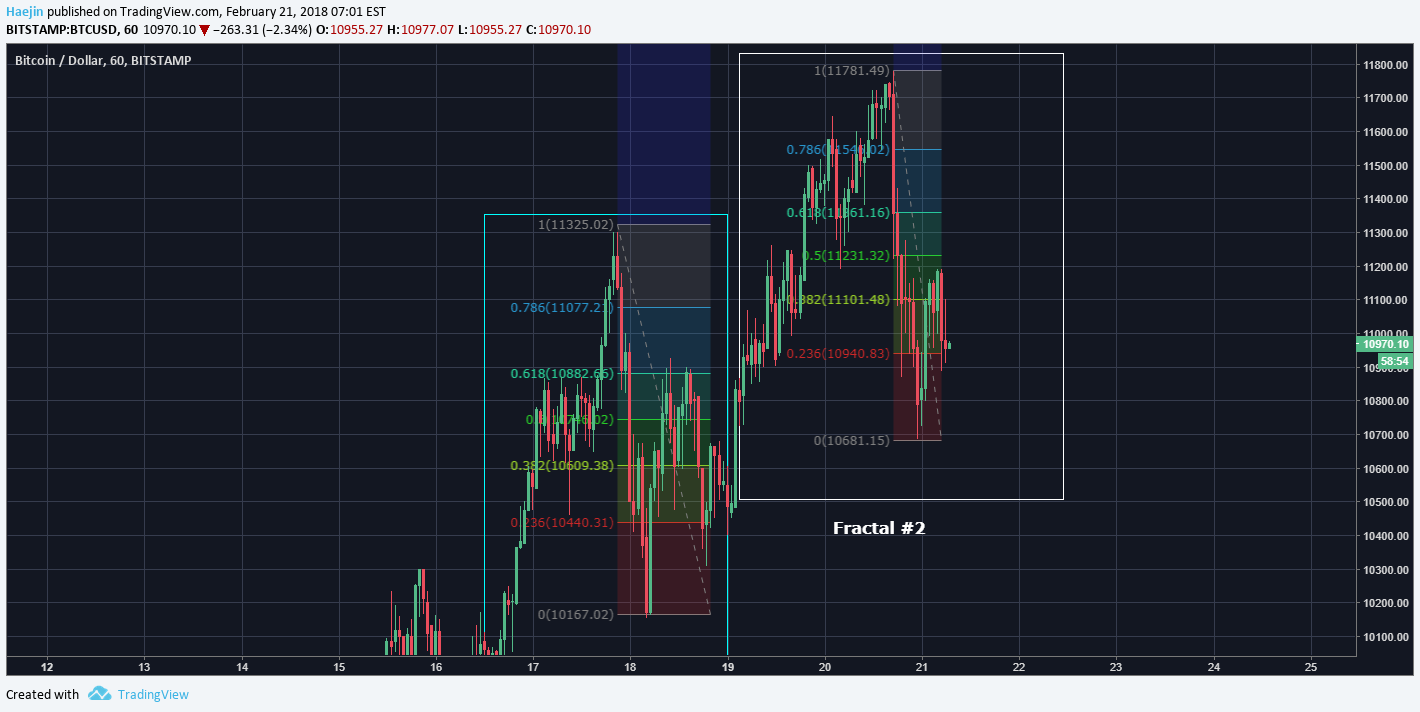
The rebound for the Fractal #1 was 0.618 Fib and if this could be the same for Fractal #2; then $11,361 could be the rebound zone for Fractal #2 as shown in Fibs below:
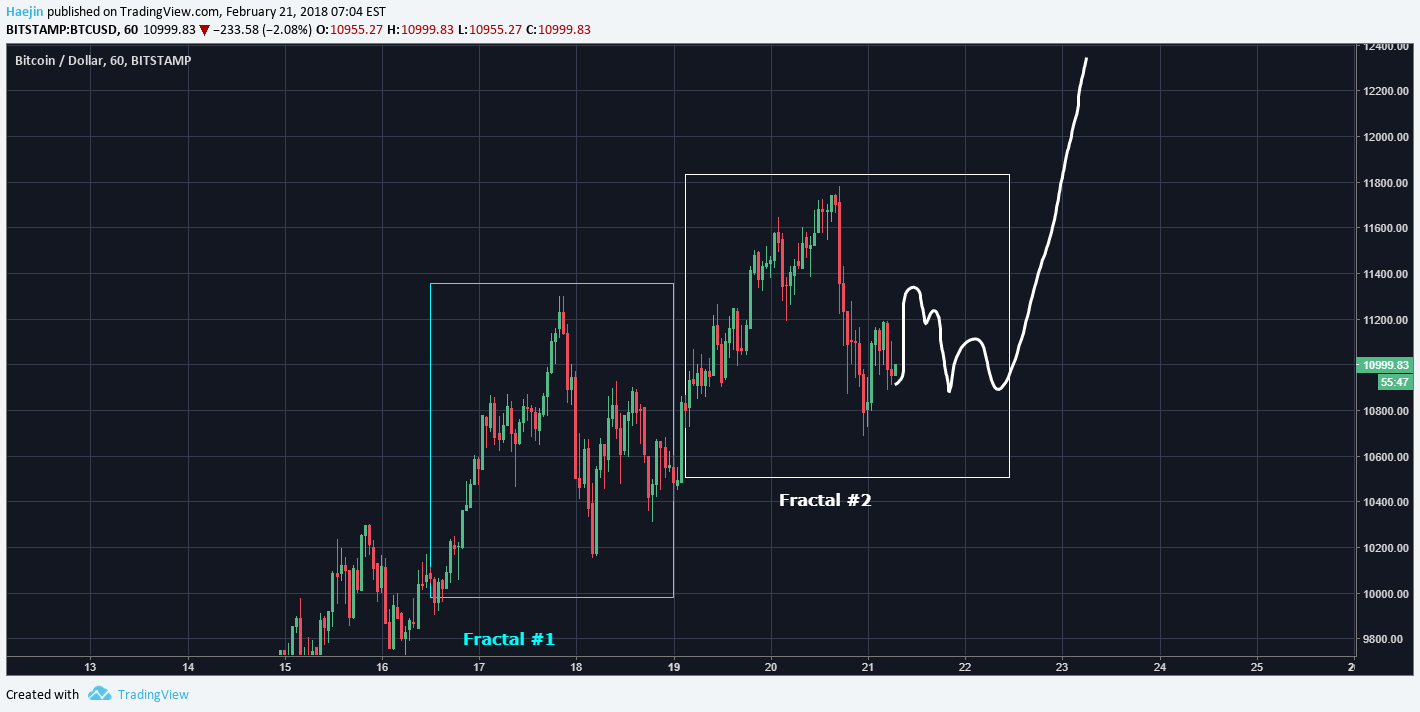
Bullish case scenario could show how the price pathway could travel by adhering to the fractal. This scenario would allow the entrance of New All Time Highs! HOWEVER, we MUST keep a vigilant eye on the current critical juncture. It's not the time to allow FEAR to dictate our trades, but rather outcome probabilities!
Legal Disclaimer: I am not a financial advisor nor is any content in this article presented as financial advice. The information provided in this blog post and any other posts that I make and any accompanying material is for informational purposes only. It should not be considered financial or investment advice of any kind. One should consult with a financial or investment professional to determine what may be best for your individual needs. Plain English: This is only my opinion, make of it what you wish. What does this mean? It means it's not advice nor recommendation to either buy or sell anything! It's only meant for use as informative or entertainment purposes.
Please consider reviewing these Tutorials on:
Elliott Wave Counting Tutorial #1
Elliott Wave Counting Tutorial #2
Elliott Wave Counting Tutorial #3
Laddering and Buy/Sell Setups.
Laddering Example with EOS
Tutorial on the use of Fibonacci & Elliott Waves
@haejin's Trading Nuggets
Essay: Is Technical Analysis a Quantum Event?
Follow me on Twitter for Real Time Alerts!!
Follow me on StockTwits for UpDates!!
--
--