Back in June and July, I wrote a few posts about the Steem inflation rate. See:
- Is the STEEM supply growth rate approaching a turning point?
- More about Steem's inflation models
- Five phases of Steem inflation
Now, as September comes to a close, I thought it would be interesting to see if things have changed, so I updated the numbers with today as a starting date. Remember, that there is no authoritative documentation on this, so this is just my best understanding. There could definitely be misunderstandings reflected here.
That said, here's what I found:
1. In terms of new blocks per day, inflation might peak between February 4 and February 12 of 2024. Coincidentally, just a couple of months before the April Bitcoin halving.
| Date | Block | Inflation Rate | Virtual Supply | New STEEM per day |
|---|---|---|---|---|
| 2024-01-17 | 81750000 | 0.065100 | 504305292 | 89945 |
| 2024-01-26 | 82000000 | 0.065000 | 505086077 | 89946 |
| 2024-02-04 | 82250000 | 0.064900 | 505866868 | 89947 |
| 2024-02-12 | 82500000 | 0.064800 | 506647661 | 89947 |
| 2024-02-21 | 82750000 | 0.064700 | 507428452 | 89946 |
| 2024-03-01 | 83000000 | 0.064600 | 508209238 | 89946 |
2. Here's what the curves look like for 1 year, 4 years, 8 years, 12 years, and 20 years.

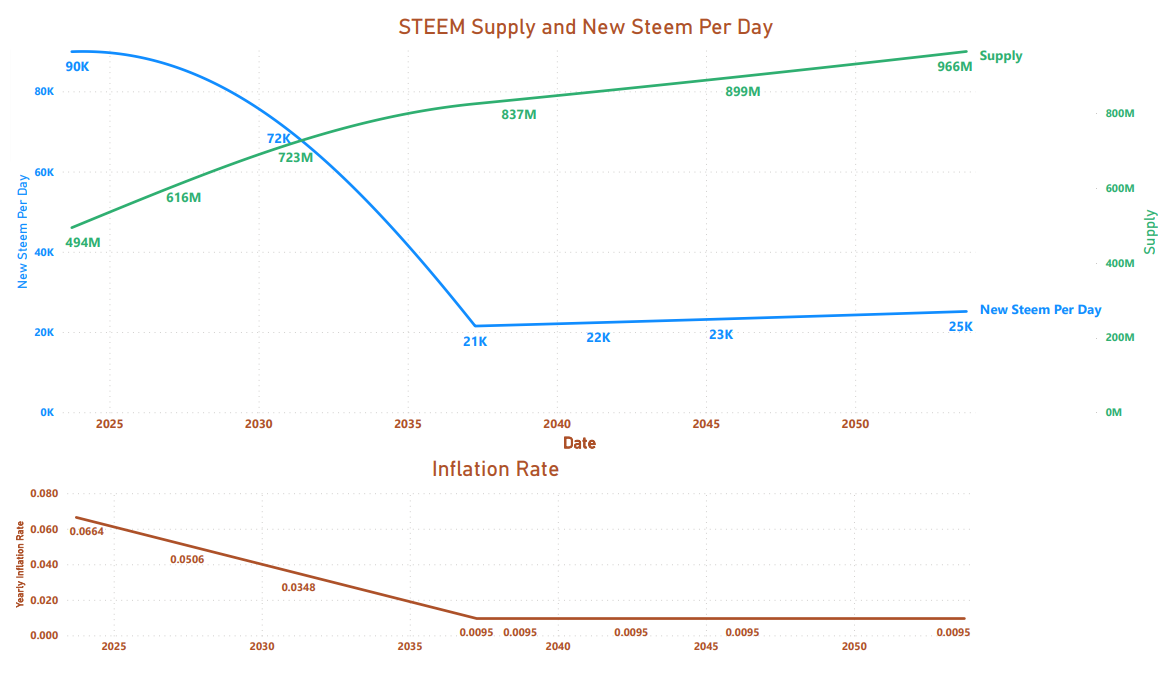
3. Here's a simple graph showing the inflation rate, virtual supply, and Steem production for the next 30 years
4. Note that according to the graph in point #2, we've already passed a sort-of milestone.
- Back in June, the block production in a year was expected to be higher than the current block production. The daily production in June was 89,830 vs. the 1 year later value of 89,940.
- Now, however, our daily production is anticipated to be lower in a year, declining from 89,903 now to 89,796 at the end of a year.
- It's also worth observing that the daily STEEM production declines by more than 5% in the next 4 years, 27% in the next 8 years, 61% in 12 years, and 75% in 20 years.
If all this is correct, the next time that the daily STEEM production would be expected to grow on a year over year basis will be some time around the year 2037 (subject to other factors discussed in point #5).
5. Remember that none of this accounts for other factors that can change Steem production rates, including:
- Burned rewards or transfers to @null for post promotion
- Missed blocks by witnesses (see here and here)
- Increases in the STEEM price that could reduce the virtual supply size.
- Other factors that I may or may not be aware of.
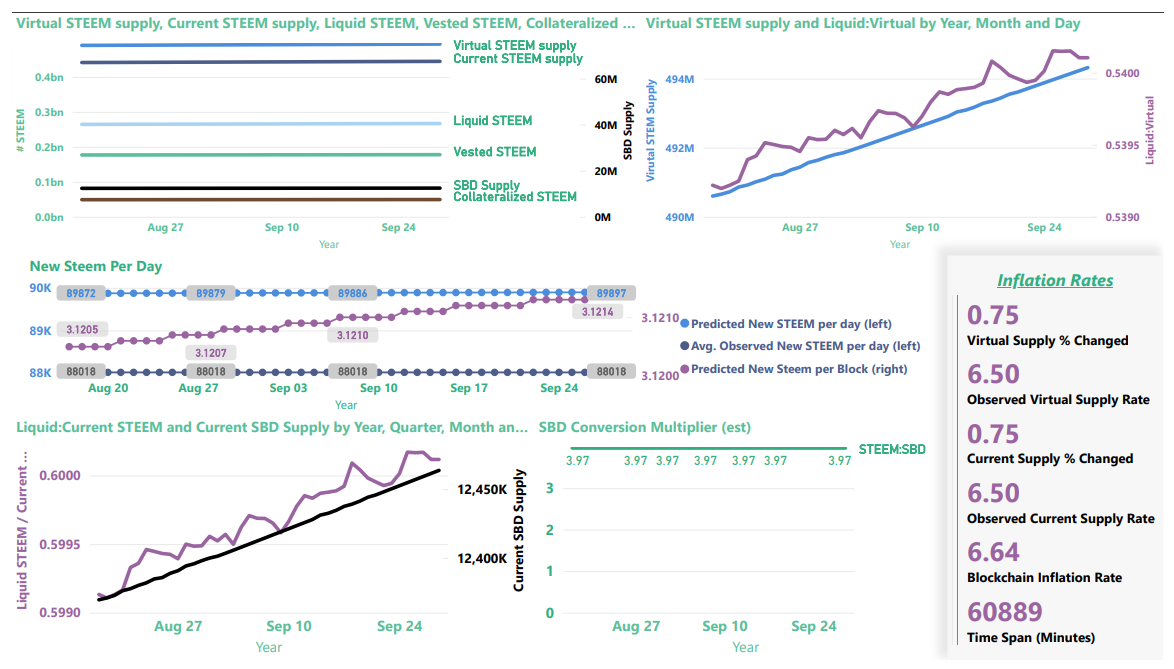
6. We can see in the middle visualization below, containing data from SteemDB, that the actual rate is currently running almost 1,900 STEEM per day below the predicted rate.
Final note: My weekly series covering burned and staked tokens are on indefinite hold until data in steemdb.io catches up to the present time after last month's API challenges; and until I decide what my Steem future is, given Steemit's latest ToS changes.
Thank you for your time and attention.
As a general rule, I up-vote comments that demonstrate "proof of reading".

Steve Palmer is an IT professional with three decades of professional experience in data communications and information systems. He holds a bachelor's degree in mathematics, a master's degree in computer science, and a master's degree in information systems and technology management. He has been awarded 3 US patents.

Pixabay license, source
Reminder
Visit the /promoted page and #burnsteem25 to support the inflation-fighters who are helping to enable decentralized regulation of Steem token supply growth.