Steemit launched the #burnsteem25 initiative on May 22, and the corresponding rewards started being delivered to @null on May 29. Since then, I have been playing around with PowerBI and steemdb.io to put together some visualizations of some related blockchain numbers. I thought that STEM Saturday might be a good day to post periodic updates.
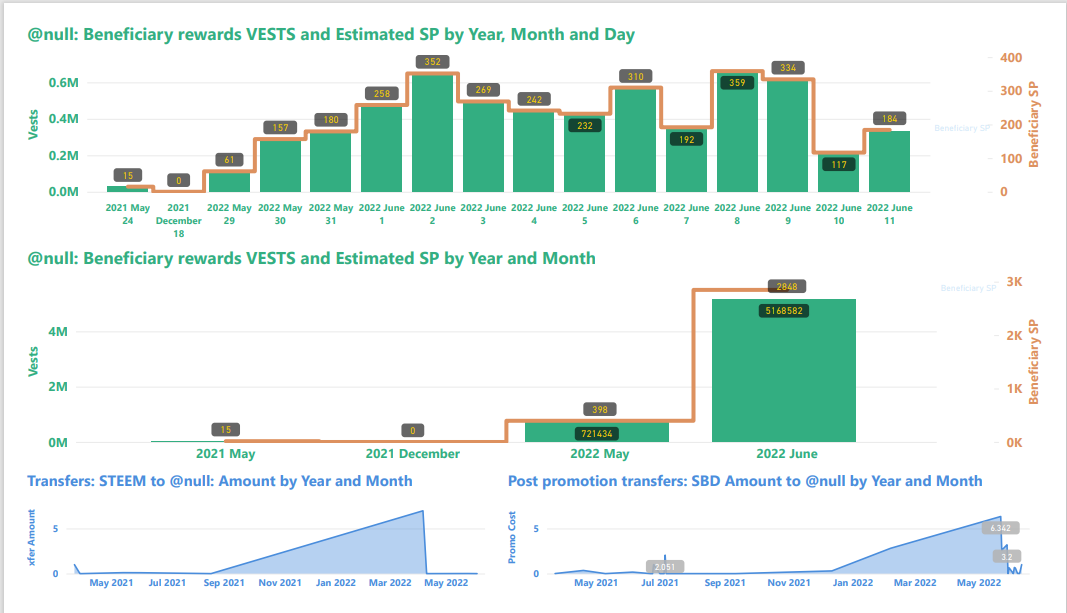
Slide 1: Burn amounts in beneficiary rewards and transfers to @null.
The visualization on top shows the daily SP/vest burn amount in beneficiary rewards, and the one in the middle shows the same numbers on a month to month basis. If liquid rewards were also included, those numbers would be doubled. From May 29 until today, the burn amount is reported at 3,246 - which makes the total 6,492 after accounting for liquid rewards.
The visualizations on the bottom show transfers to @null - STEEM on the left and SBD (for /promoted) on the right. To the best of my knowledge, transferring STEEM to @null has zero promotional value, so the chart is just included for completeness.
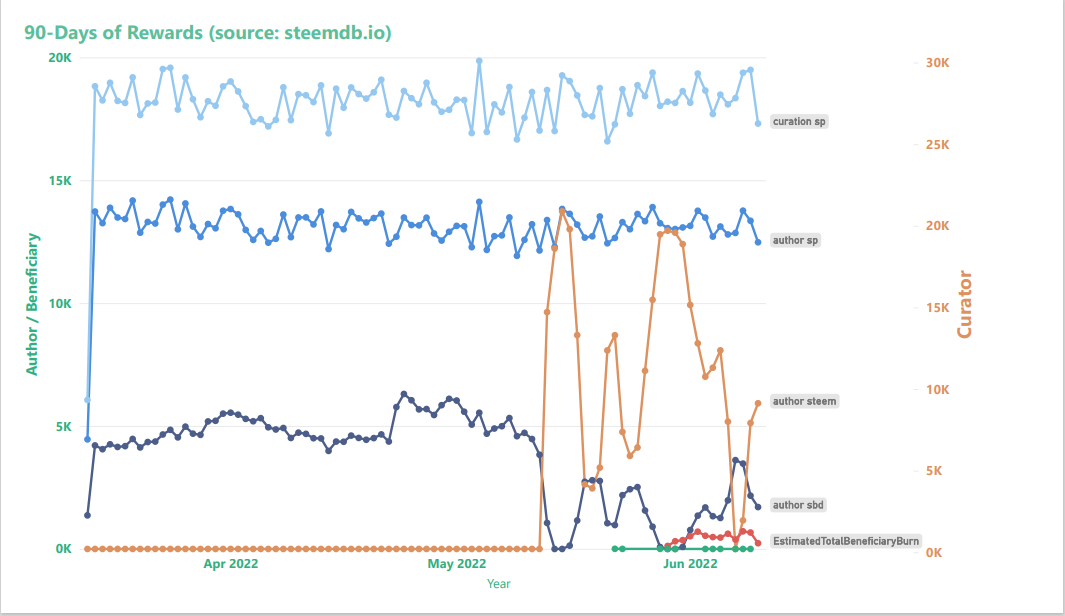
Slide 2: Rewards summary
Curator rewards use the scale on the right, author and beneficiary rewards use the scale on the left. Beneficiary rewards in this chart (red) have been adjusted in order to account for both SP and liquid rewards.
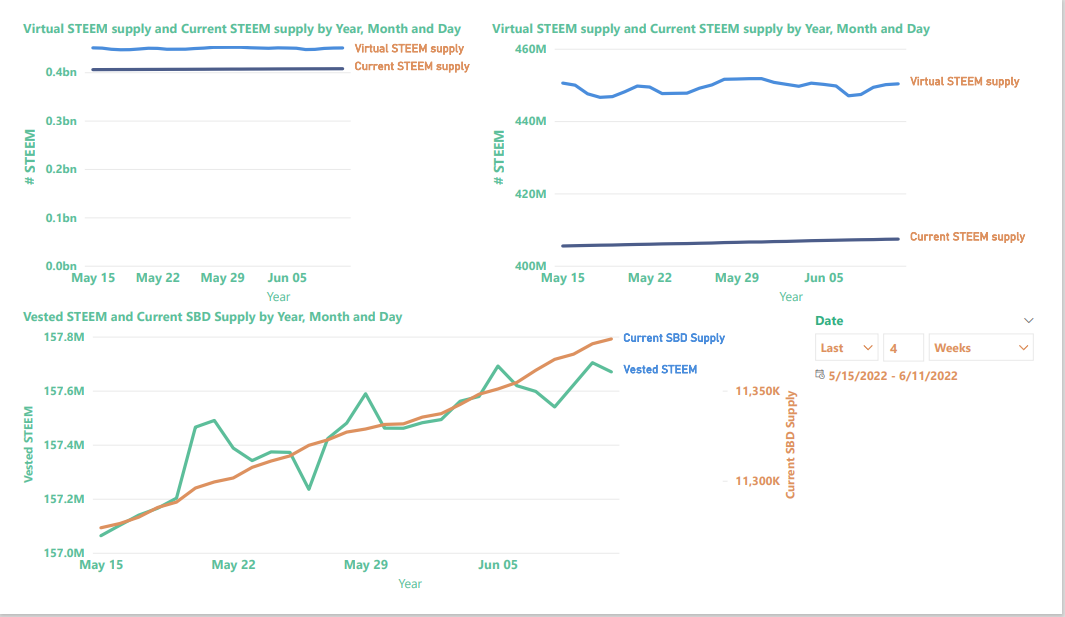
Slide 3: STEEM & SBD Supply as well as vested (i.e. staked or "powered up") STEEM
The two graphs on the top represent the same numbers. On the left-hand side, the axis is scaled to zero. On the right, it zooms in on the top of the chart.
In the bottom chart, don't read too much into the fact that the two lines appear to correlate. A lot of that is just from PowerBI's automatic scaling.