Beat Frequency
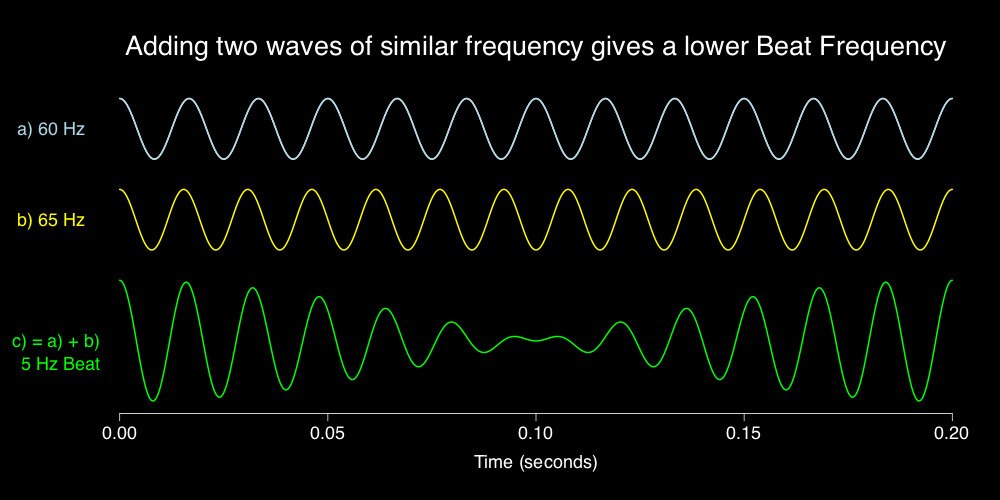
First I had the idea of writing a post explaining Beat Frequencies. This effect can be subtle and sometimes also quite powerful, when two waves of different frequency are added (‘superposed’ as physicists might say). The waves could be sound waves, water waves, electrical waves, etc. Here’s an example that I made using the freely available R software package.

The beat frequency is just the difference between the two original frequencies, which for the example above comes to 5 Hz (5 cycles per second). So, the beat makes one cycle every 1/5 = 0.20 second. Note how the combined signal reaches zero amplitude when the peak of one source signal (b) occurs at the same time as the valley of the other (a). Then, they cancel. When the peaks line up with the peaks, the combined signal is twice as strong to the positive, and when the valleys line up, it has twice the strength of each original wave in the negative direction. (I made the strength, or amplitude, of the source waves the same for this example.)
Thus the beat pattern is the result of interference between the two waves. ThePhysicsClassroom has a more thorough explanation of Interference and Beat Frequencies
I’ll include the R script for that example at the end of this post. With it, you can plot the outcome for different combinations of frequencies.
Binaural Beats
Then I started looking for interesting examples of observable beat frequencies. There are many from acoustics and physics. It was then that I first came across Binaural Frequencies. These are fascinating!
Briefly, the neurological signals in our brains have certain frequencies. When we’re awake and active these frequencies are higher, and when we’re relaxing or sleeping our brains slow down to lower frequencies. The low brain frequencies are well below the frequencies of the deepest bass from a hifi subwoofer. Binaural Brains has more in depth explanations.
Tuning through Trickery
Nevertheless, it’s possible to use beat frequencies to tune our brains to specific frequencies, either for concentration or relaxation. You can think of it as tricking the brain. It’s also described as an auditory illusion.
This is done by playing slightly different frequencies into the left and right ear, using headphones or earphones. The difference between the two frequencies, which defines the beat frequency, needs to be less than about 40 Hz. The brain then experiences the beat frequency as the two neural signals interact.
Want to try it?
Brainwave Hub provides lots of resources, including soothing binaural beats to enhance mental focus, which you can freely play directly through your headphones or earphones. I was enjoying this one as I made the beat frequency example above. I was able to concentrate quite well, but I need to try it more before I can say whether or not the beats enhance my ability to concentrate.
R script
To use this you’ll need to paste, type, or source (from a file) the code below into a working installation of R, which is available from the R-project. Then you can call the function that generated the example above by entering the following at the command line:
fig.beatfreq()
It should generate a .png graphics file, “beatfreq.ex.png”.
In R, function calls require parentheses after the name of the function, even if no arguments are given. Calling the function this way uses the default values of all arguments, which are defined in the script below.
You can call the script for different frequencies, f1 and f2, by entering, for example:
fig.beatfreq(f1 = 59, f2 = 61)
If you do that, you may also want to adjust the maximum time, tmax, to show the whole beat cycle. For a beat frequency of 2 Hz, the cycle will complete in 1/2 s.
fig.beatfreq(f1 = 59, f2 = 61, tmax = 0.5)
Here’s the script: beatfreq.r
S. Lan Smith
Kamakura, Japan
September 12, 2016
Thanks to those who provided the images, all of which were labeled for free reuse.
