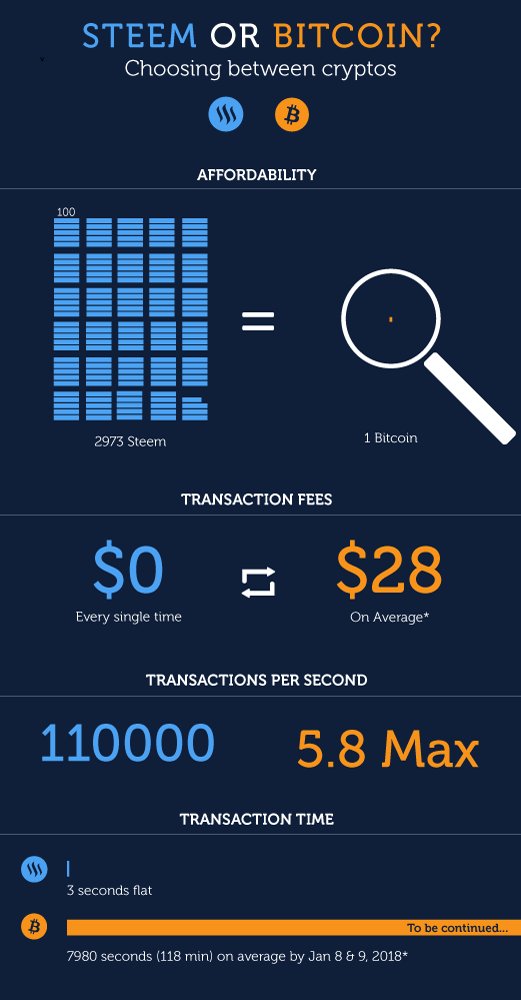
Infographic showing some differences between Bitcoin and Steem
For this infographic I focused on comparing Steem and Bitcoin only. I feel that mainstream media doesn't really promote other cryptocurrencies as much as Bitcoin, so, I wanted to show the obvious advantages of Steem to people outside the cryptocurrency world. .
Most of the design was focused on type and graphs as visual elements. Color-coding served to identify each brand and categorize the information on each side of the design
Research
I used the data provided by the @sndbox in the post @sndbox/steem-stats-infographic-contest-announcement-big-upvote-prizes, but I also searched for more data in different websites.
Price comparison is based on https://coinmarketcap.com/ in which BTC was at $14681.5 & STEEM at $5.36 by Jan 10, 2018, 2pm. That gave me a 1 Btc to 2973 Steem ratio.
Fee price was established according an article by CNBC found at: https://www.cnbc.com/2017/12/19/big-transactions-fees-are-a-problem-for-bitcoin.html. They extracted the $28 average fee from BitInfoCharts.
Transaction confirmation time was based on most current data of Jan 8 and 9 of 2018, which is established at an average of 118 minutes according to https://blockchain.info/charts/avg-confirmation-time?daysAverageString=7×pan=30days&showDataPoints=true
I did find an snippet of information about transaction time for Btc being 10 min, but I think that was from last year. I'm still unsure if transaction time and transaction confirmation time are the same...
Thank you for reading this post. I had a great time creating this entry and wish all participants good luck!
