Aggregated STEEM flows intensity statistics from last 2 weeks:
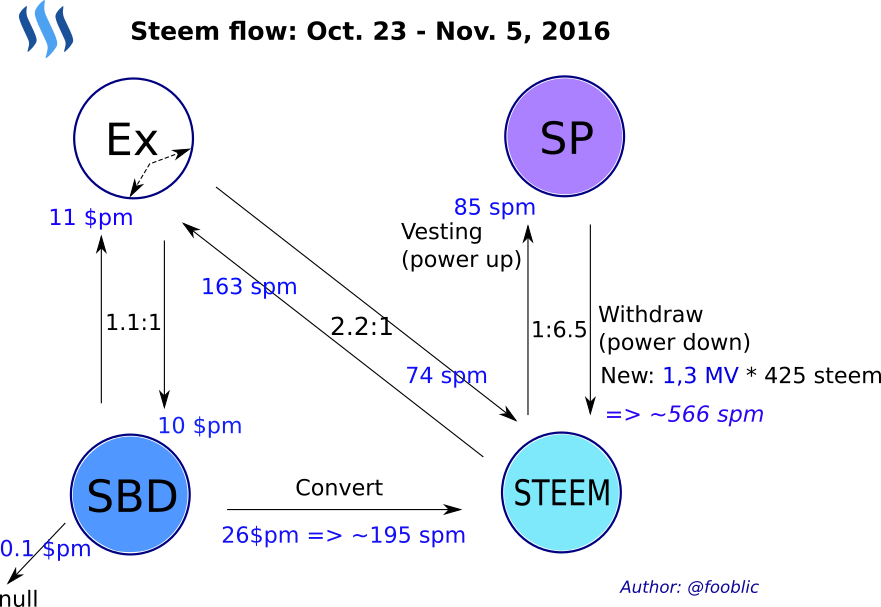
Legend:
spm- STEEM per minute$pm- SBD per minute
This is the second post that is continuing issue from my previous post. Now steem_flow2.py script is capable to store calculated data in Redis DB as I promised in previous post. Also it is possible to display stats over web-server and generate statistics graphics per day.
STEEM blockchain transaction statistics tool:
- calculate average STEEM & SBD flows intensity and ratio;
- store data in database (Redis DB);
- display stored data over web-server (Twisted framework);
- plot statistics graphics (Pandas, Matplotlib).
Daily STEEM/SBD flows statistics:
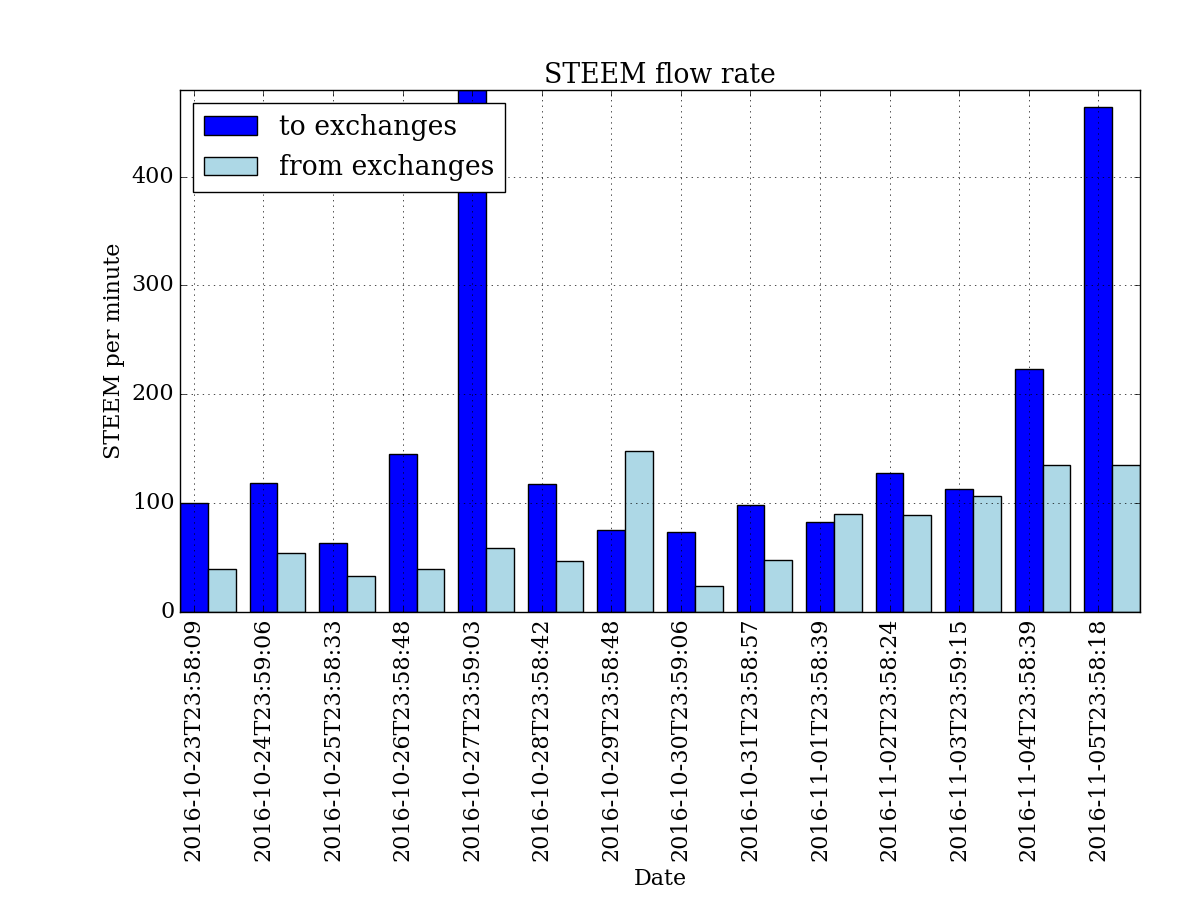
As we see STEEM flow in direction to exchanges prevails and press STEEM ex-rate down.
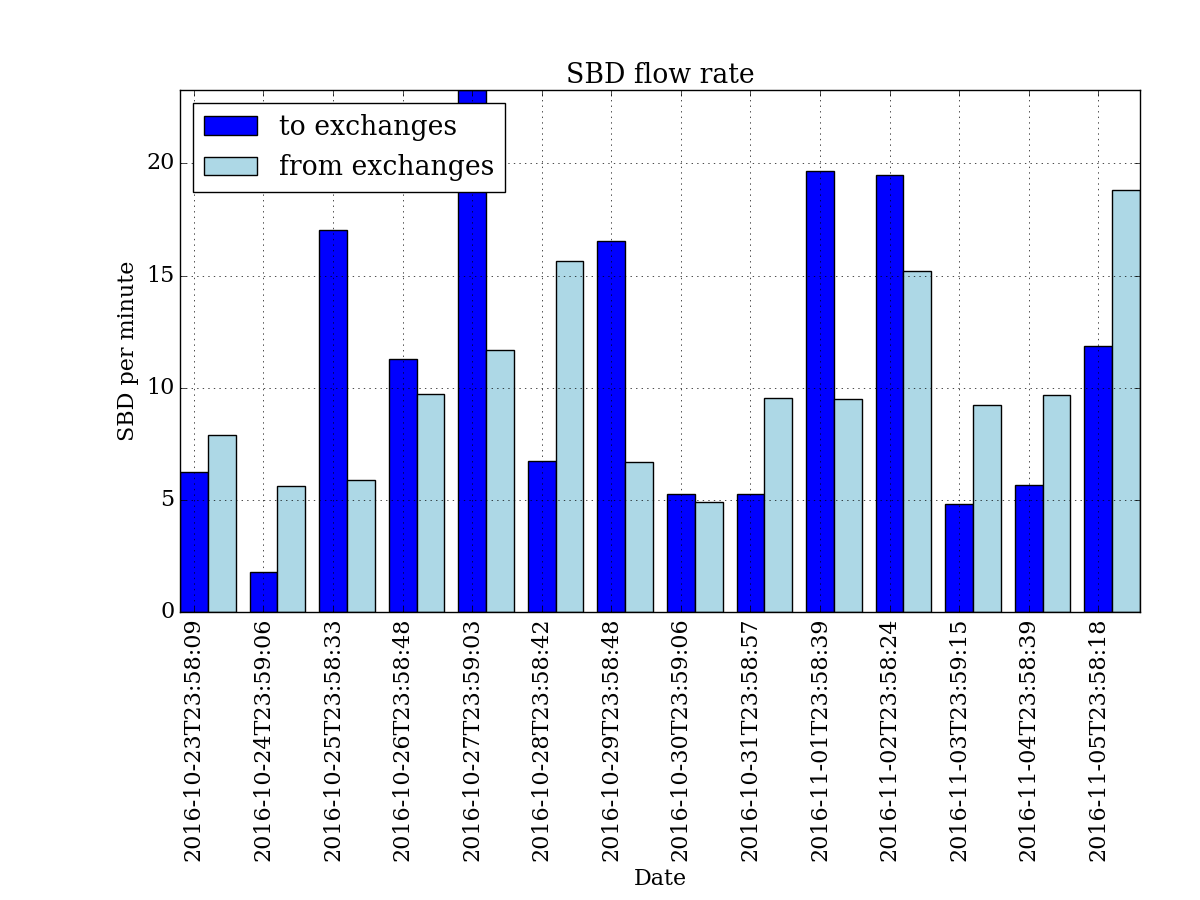
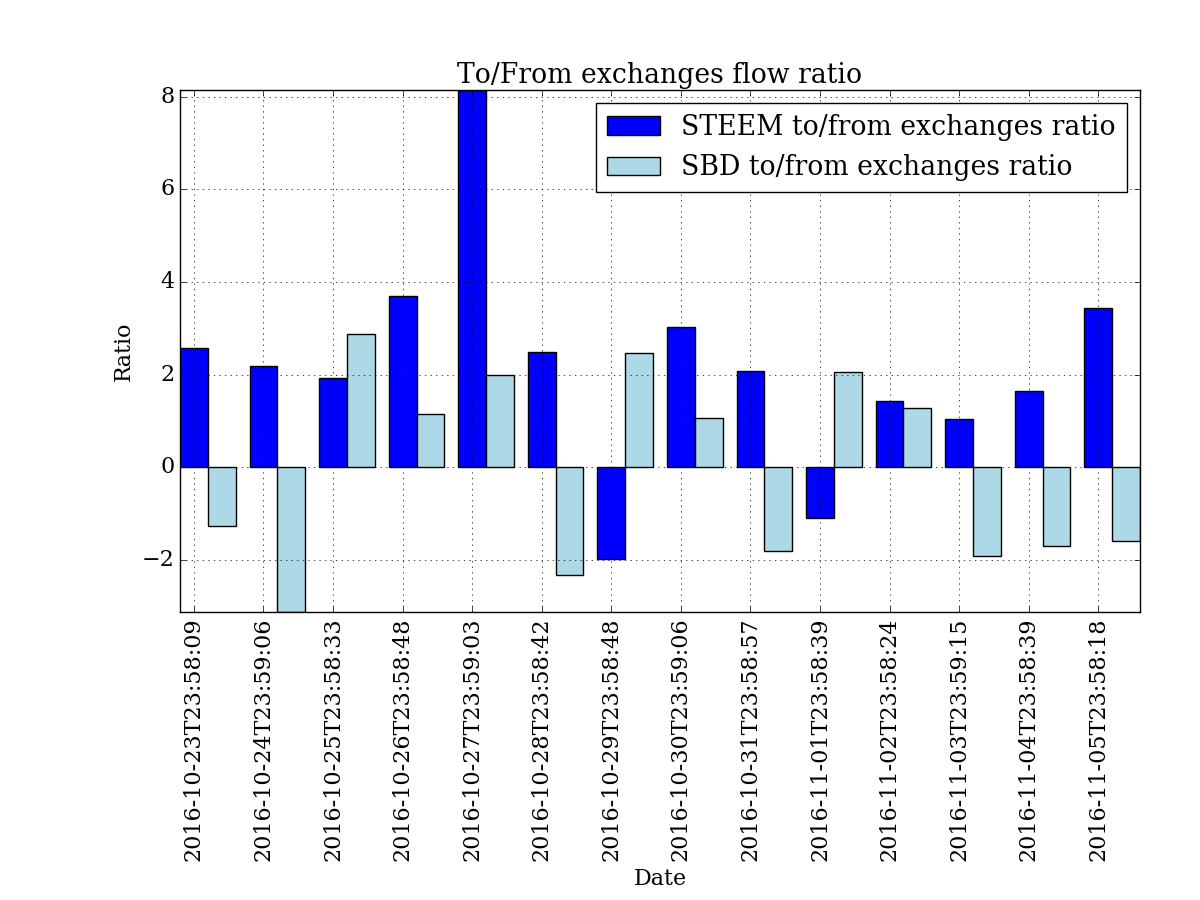
SBD flow to/from exchanges is almost the same in average.
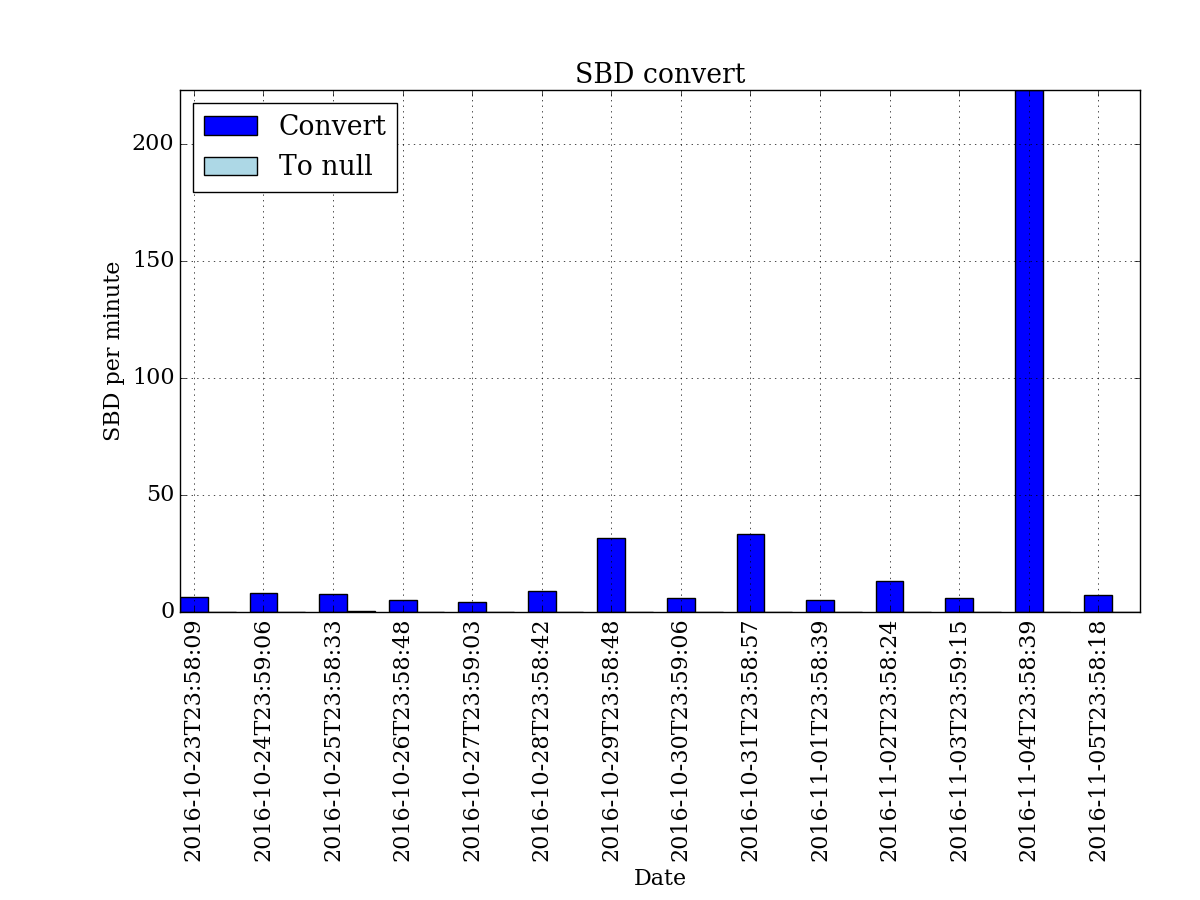
SBD convert flow is more intensive than exchange flow and sometimes we could observe extremely high peak. SBD to null flow (post promotion) is not significant.
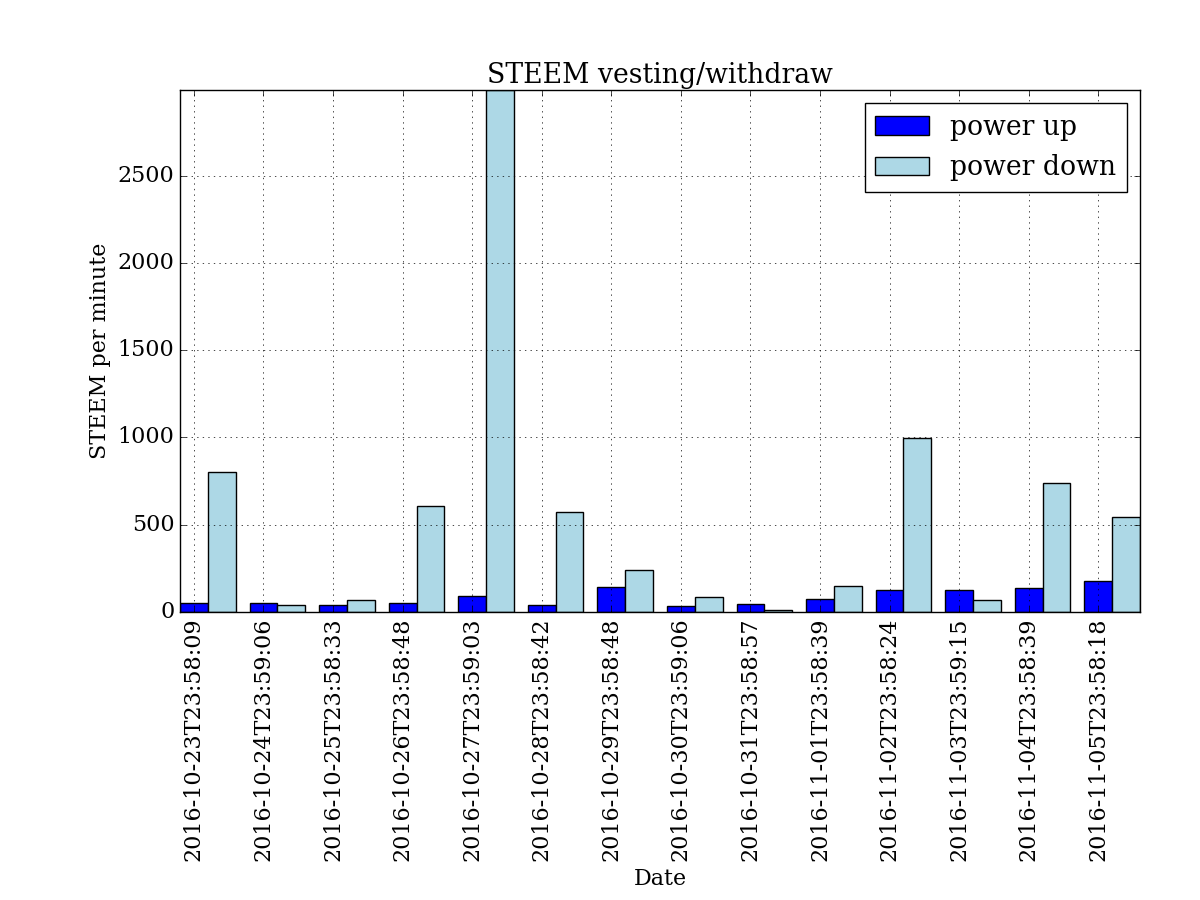
As usual power down is several times more intensive than power up with withdrawals occasional peaks.
All source codes could be found on github: https://github.com/fooblic/steem-flow
Further I plan to prepare aggregated statistics on weekly and monthly base as well.