
This post is a weekly, evolving post, analysing Steem(it) by numbers and deducing trends of interest for this project moving forward. It has been an interesting week, there has been a marked increase in high profile sign-ups following on from last week, and on a subjective basis, quality content is coming 'thick and fast'.
There has been some interesting numbers that have come out of this week analysis. Week 2 had the implementation of the Reputation System which (I believed) affected results. Week 3 has had a User Interface update, which I don't believe will impact numbers in anyway, so these numbers should give us a true reflection of Steem(it) evolution, albeit over a very short period of time.
Week 3 Highlights:
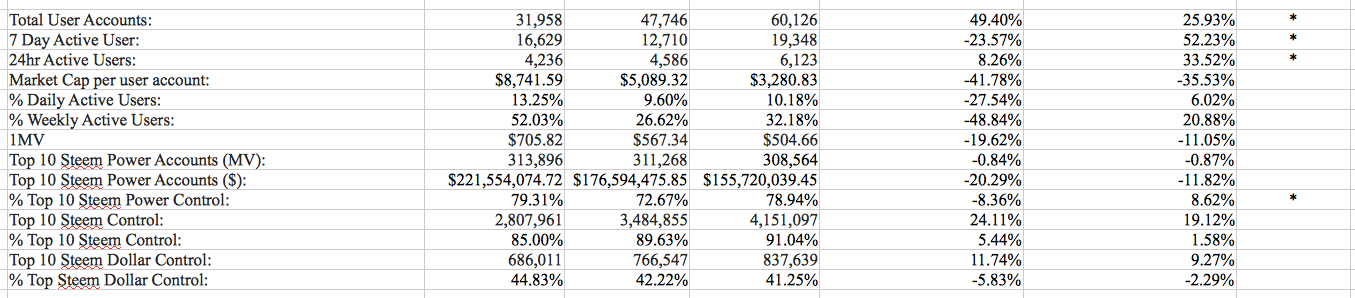
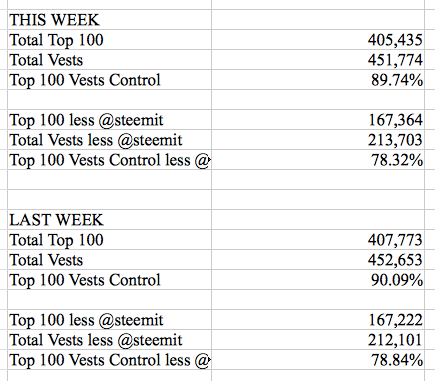
- Top 100 Biggest Steem Power Accounts are experiencing Falling Steem Power Control:
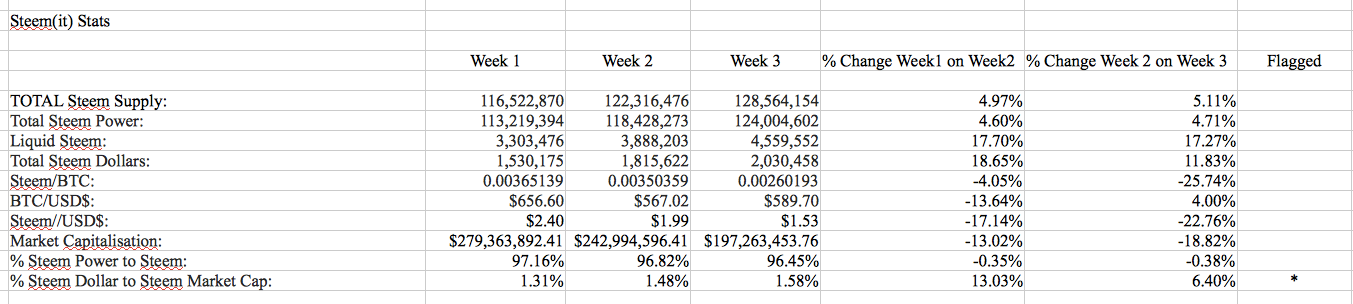
The numbers on this can be viewed at the bottom of this of my Excel Screen Shots. Depending on which way you look at it, the numbers vary, however by both measures, Steem Power Control of the Top100 accounts has fallen either 0.35% or 0.52%. This is in line with previous analysis I have done which can be found here - % Steem Dollar to Steem Market Cap Only Increased 0.1% This week:
One concern I have heard many user raise is, in a market of falling Steem Value, the amount of Steem Dollars (which is essential debt) would increase dramatically against the total value of Steem. Steem price fell 25% this week, however this metric did not rise significantly - User Base swells
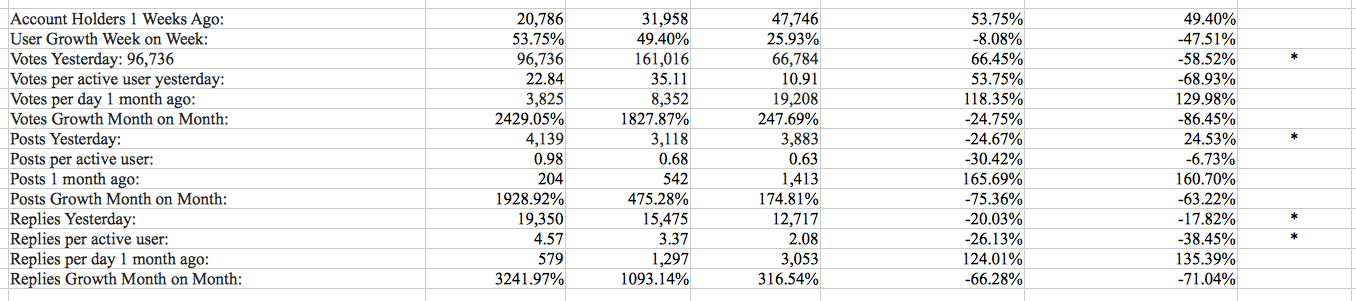
Week on Week 7 days active users has increased over 50%. That's serious growth - Votes fall 58%
Not sure what has happened here. User base has swelled, but total activity on Curation has fallen by roughly the same amount. This will be a statistic to follow over the coming weeks. Could it be that Steemit's users base was more selective with their votes, or, less engaged this week...Maybe we will be calling this the Olympic's Effect in a few week times... EDIT: @rainman pointed out an update in client by the witnesses this week have prevented bots from vote spamming. - Post Week on Week up 25%
This makes sense, and lends credence to the increasing user base numbers - Replies Fall 17% Week on Week
Again, an interesting statistic, and one which suggests a less engaged user base this week. It will be interesting to see these numbers over the coming weeks...
EDIT: this is likely down to the demise of posting bots. With thanks to @jl777
You can see last weeks numbers as Week 1, Week2 and this weeks numbers as Week 3. The Data was captured around 3-4pm on both days (Saturday). The % Change Week on Week is the best reflection of how Steem(it) is evolving, and has changed over the relatively short period period of time. For this week, we need to pay attention to column '% Change Week2 on Week3'

Top 100 Accounts Analysis
I will work on these Statistics over the coming week to get this information as useful and relevant as possible. Feel free to make suggestions of changes, or additions, and I will do my utmost to include them in the follow edition next Saturday.
Happy to discuss any of my findings with anyone interested.
I am heading out for the evening (On GMT London Time) But I will reply to any queries or questions when I get home a little later.
Have a great evening all!!!!!