
STEEM prices have shown some resilience in the face of some volatile Bitcoin trading over the past week.
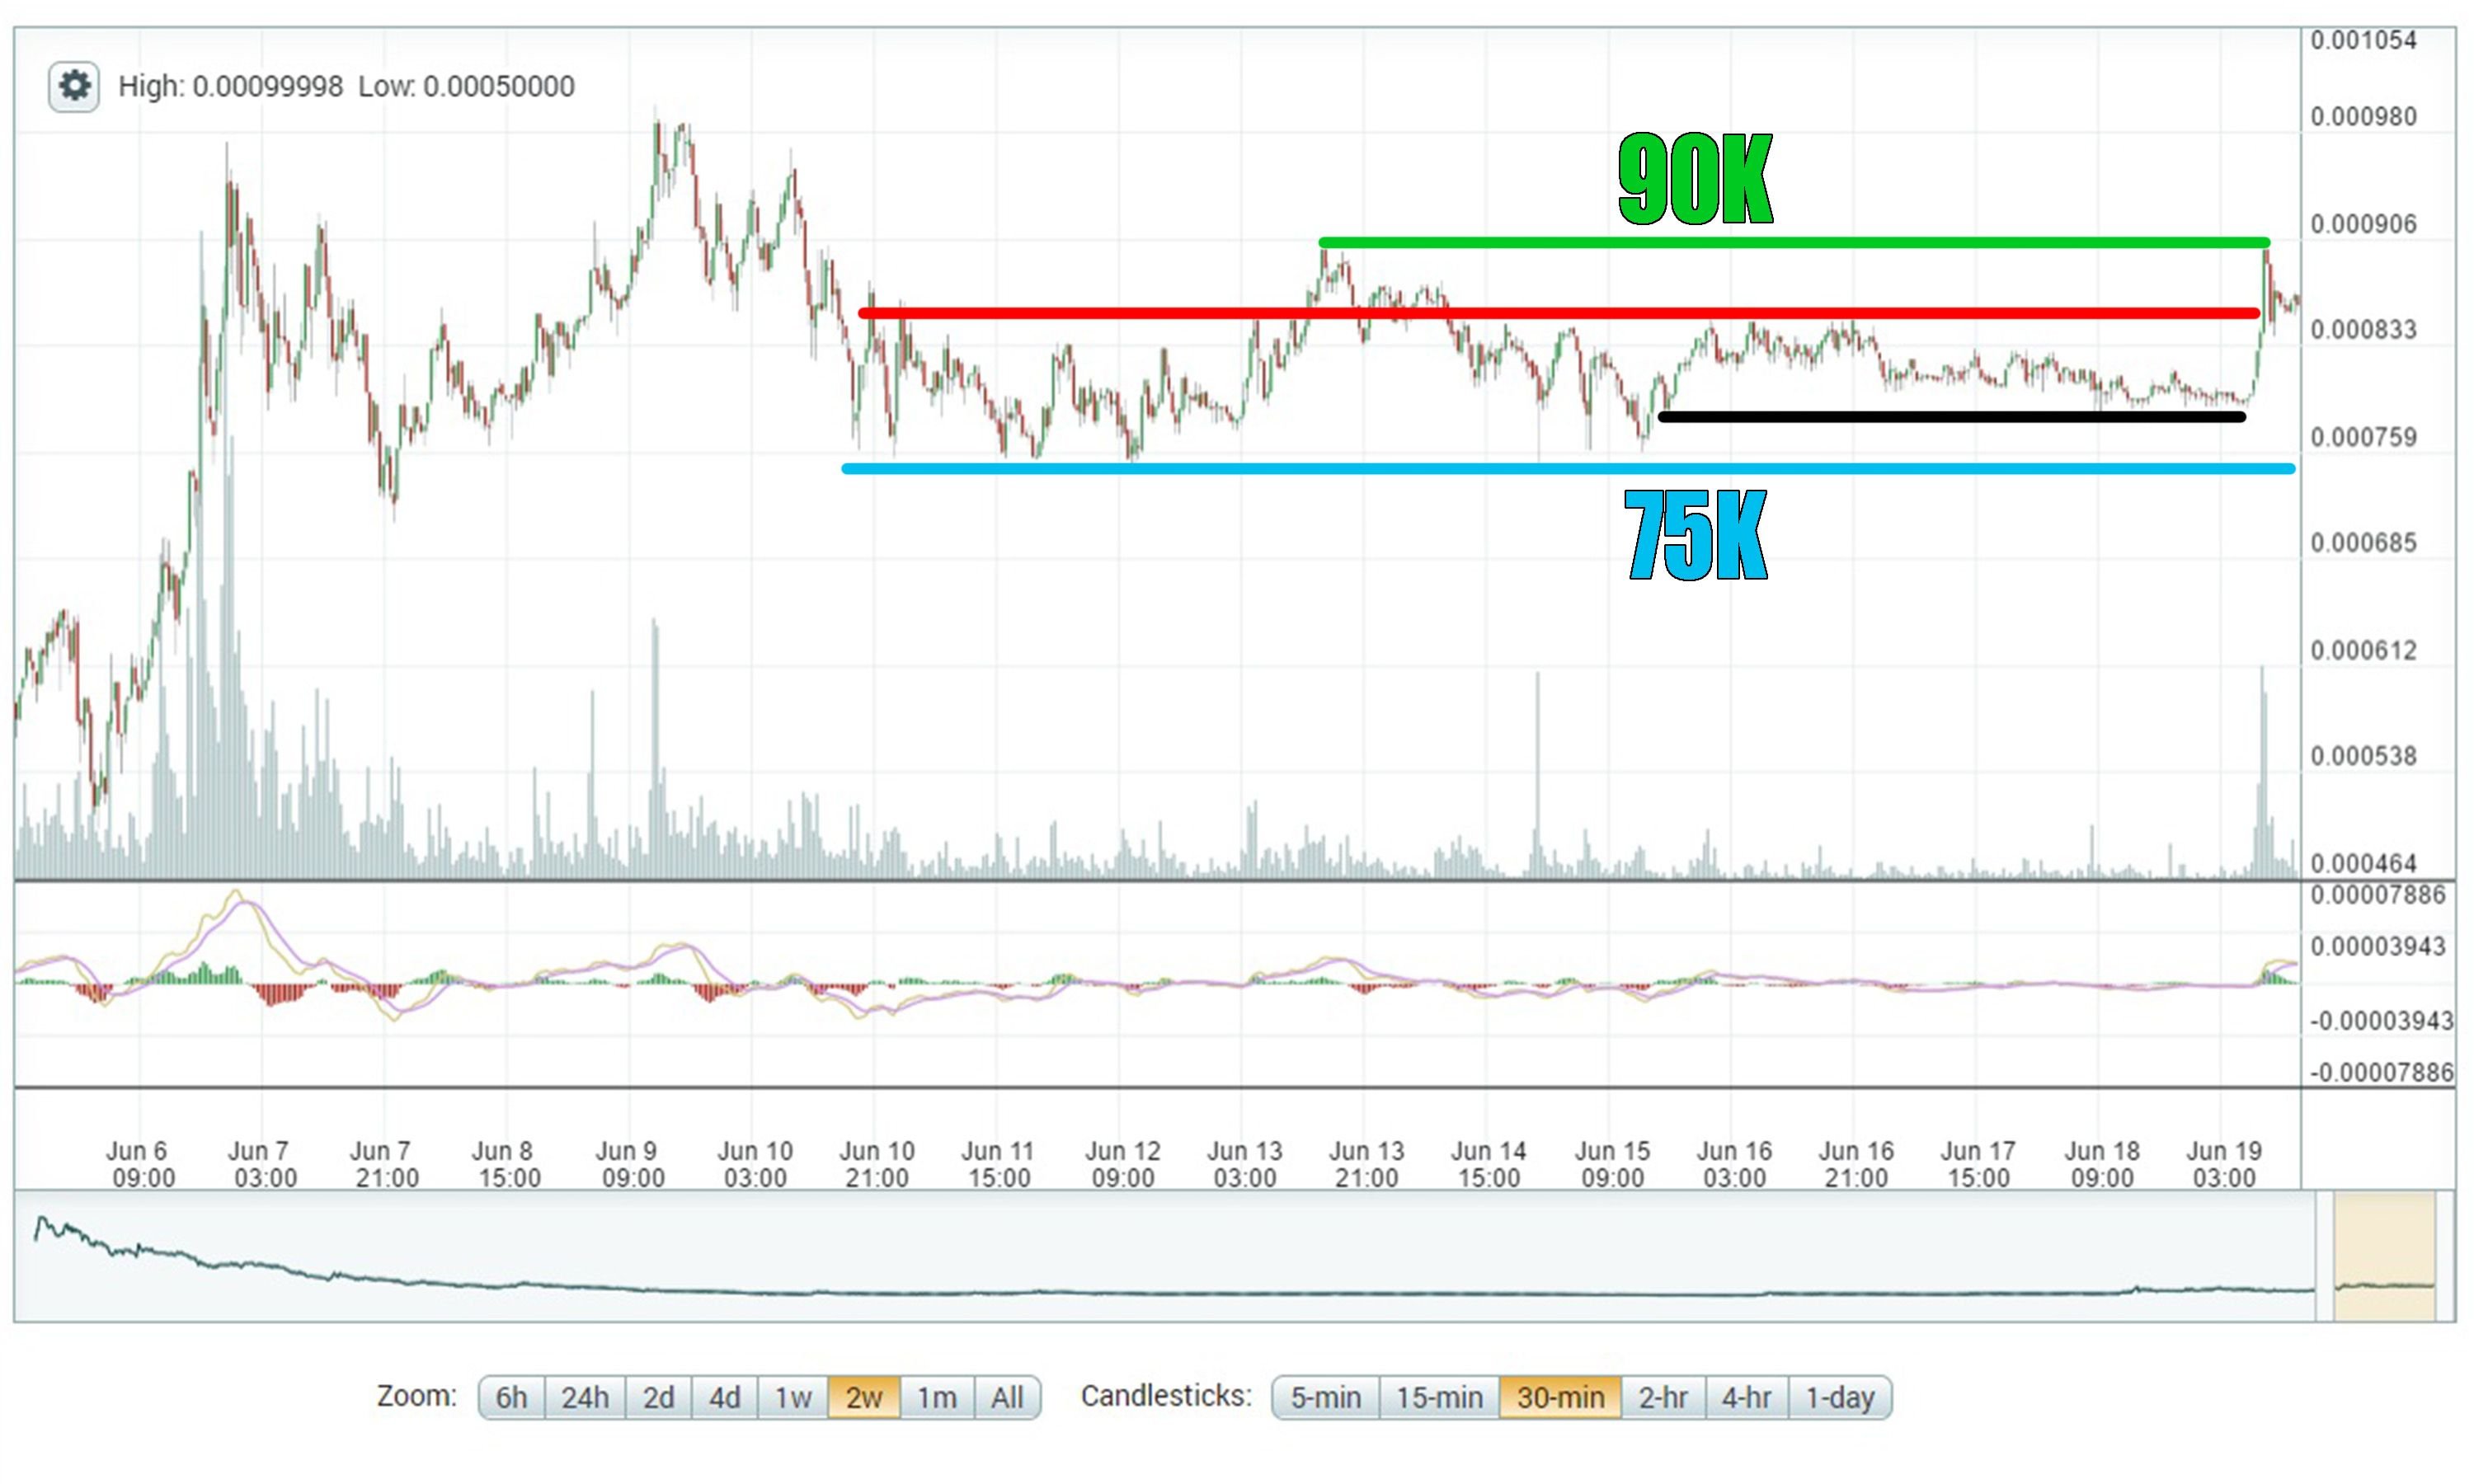
Despite several tests of support at 75K satoshis, the STEEM-BTC price held up and has recently moved upward to hit a wall at 90K satoshis once more. This is the second time in the past week that 90K has stopped an upward push.
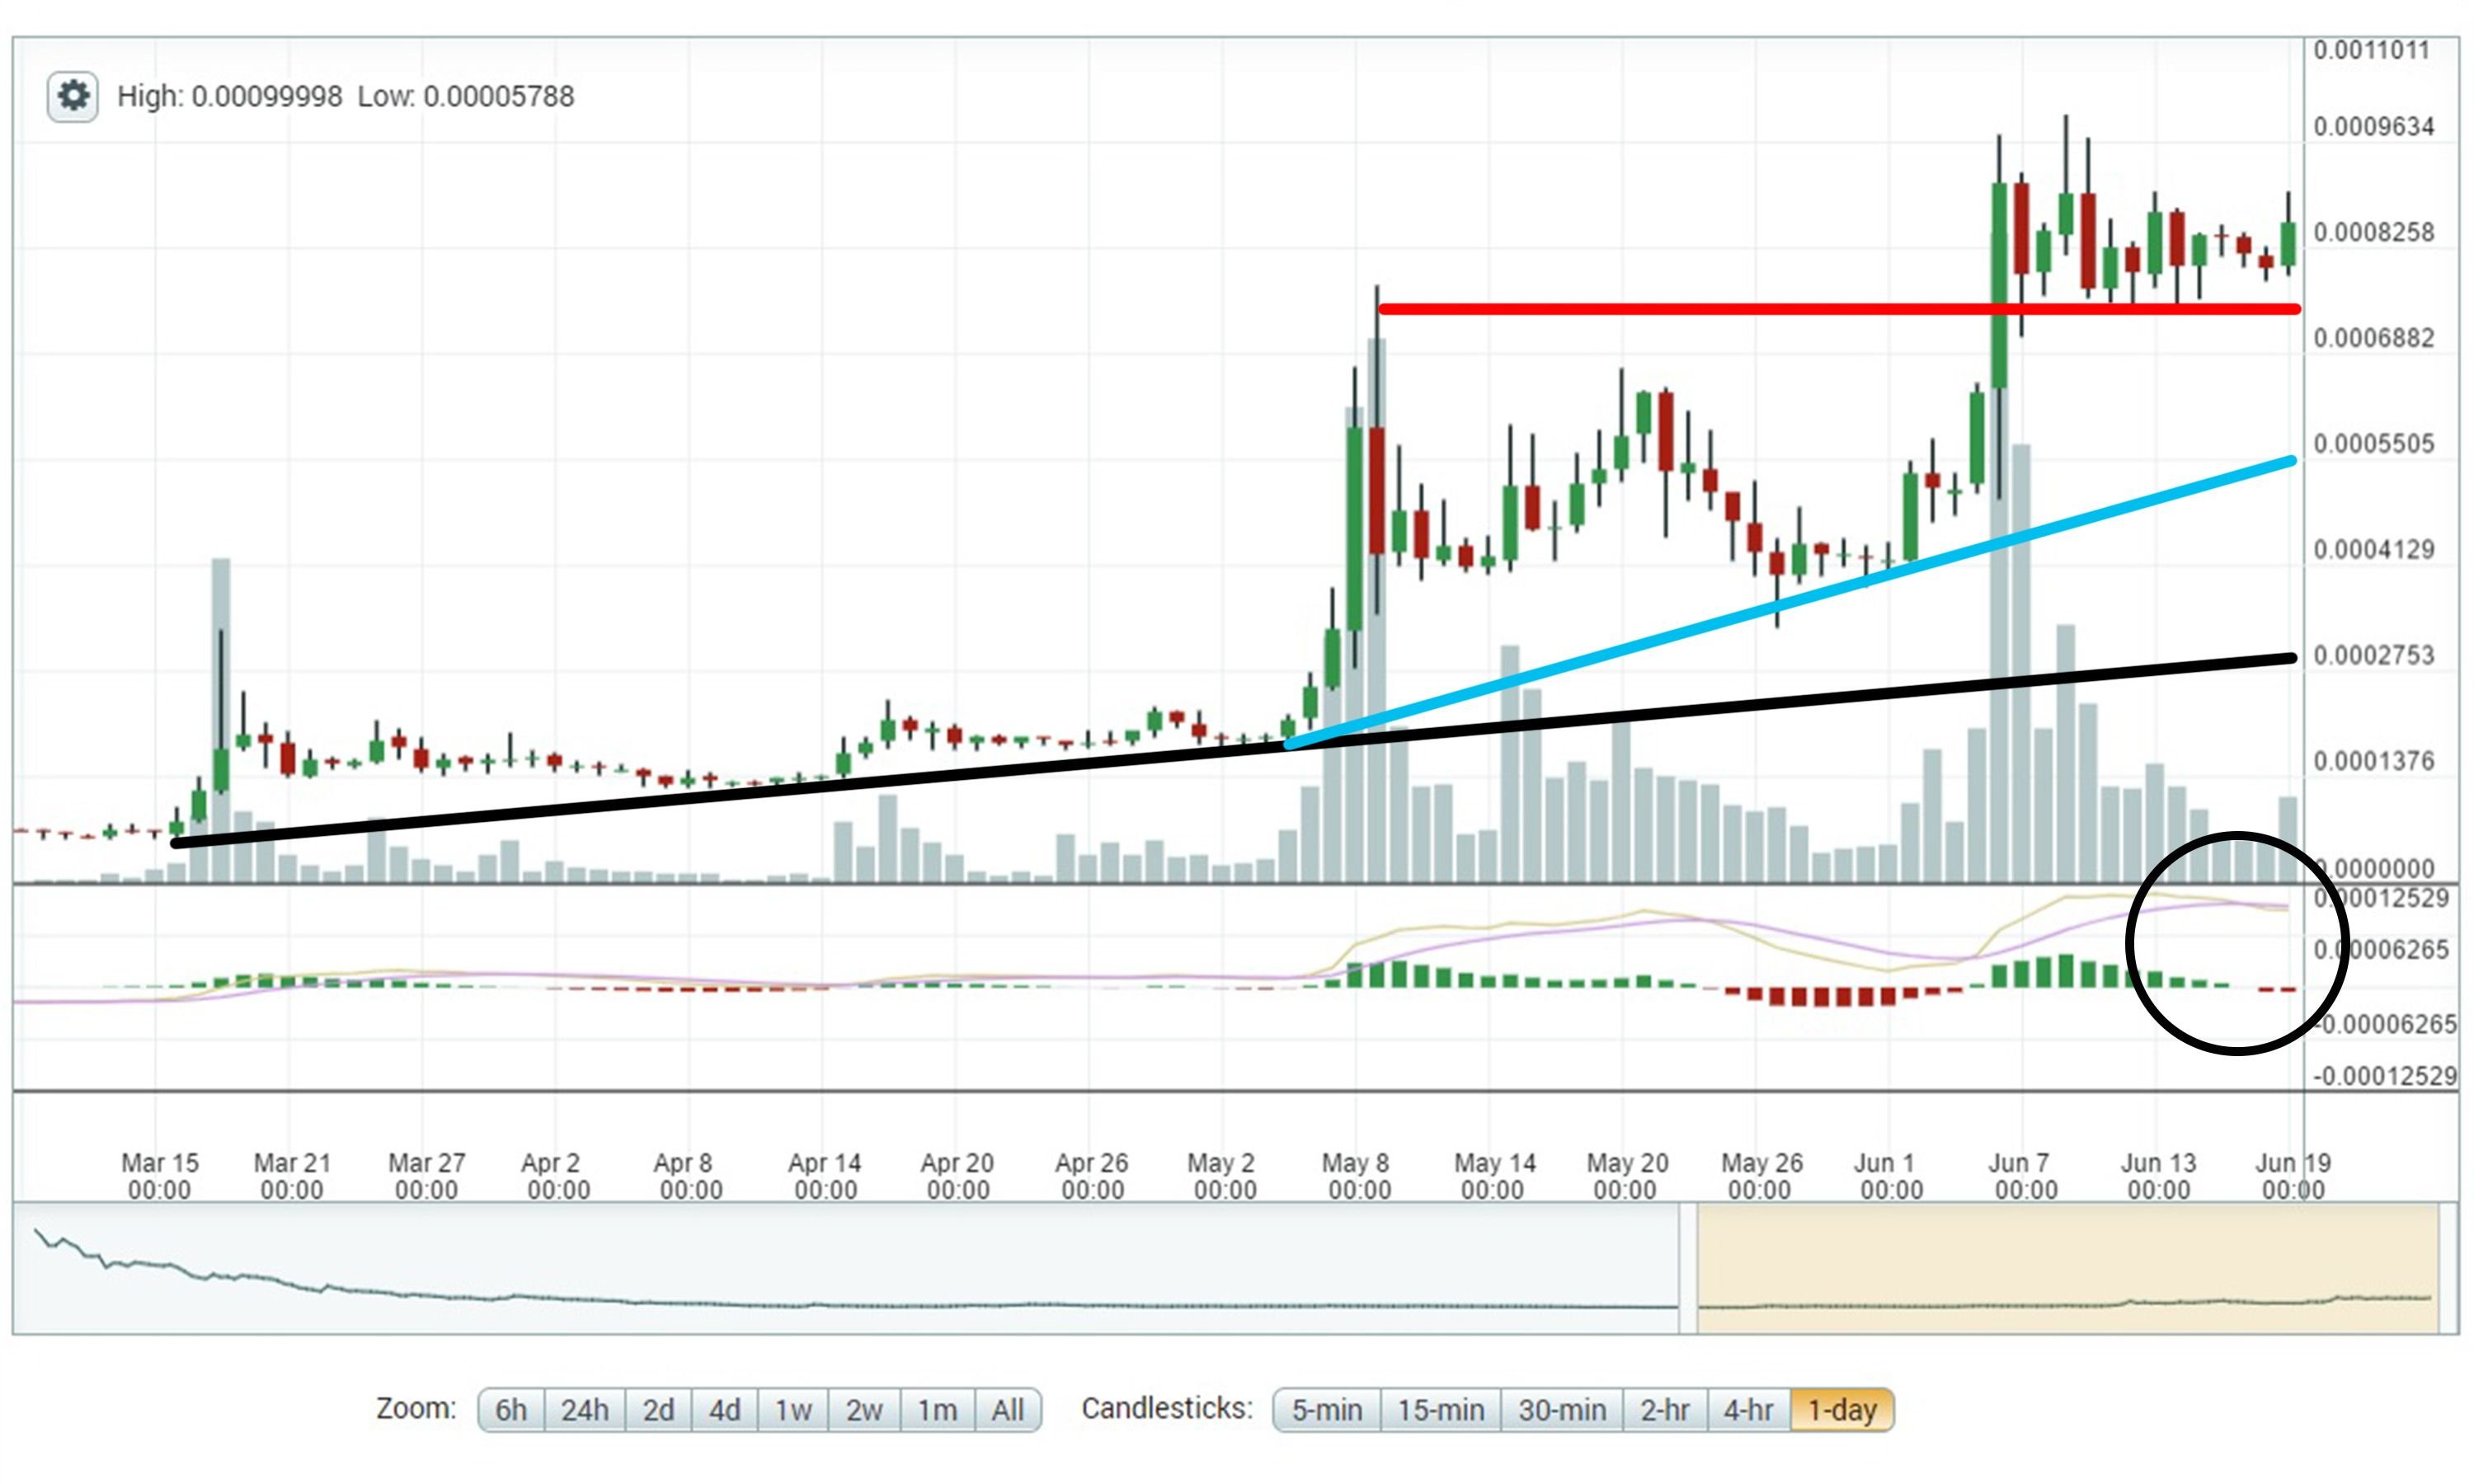
The takeaway on the longer-term chart is that the STEEM-BTC price is still in a strong uptrend from the March 2017 lows. That uptrend line (black, chart below) is pointing at 29-30K satoshis. The most recent uptrend line beginning in early May (blue) points at a current target of ~55K satoshis. Over the past two weeks, the STEEM-BTC price has not fallen below 75K (red line), so it has been showing some great strength, despite decreasing volume and momentum that has slightly turned over on the daily chart.
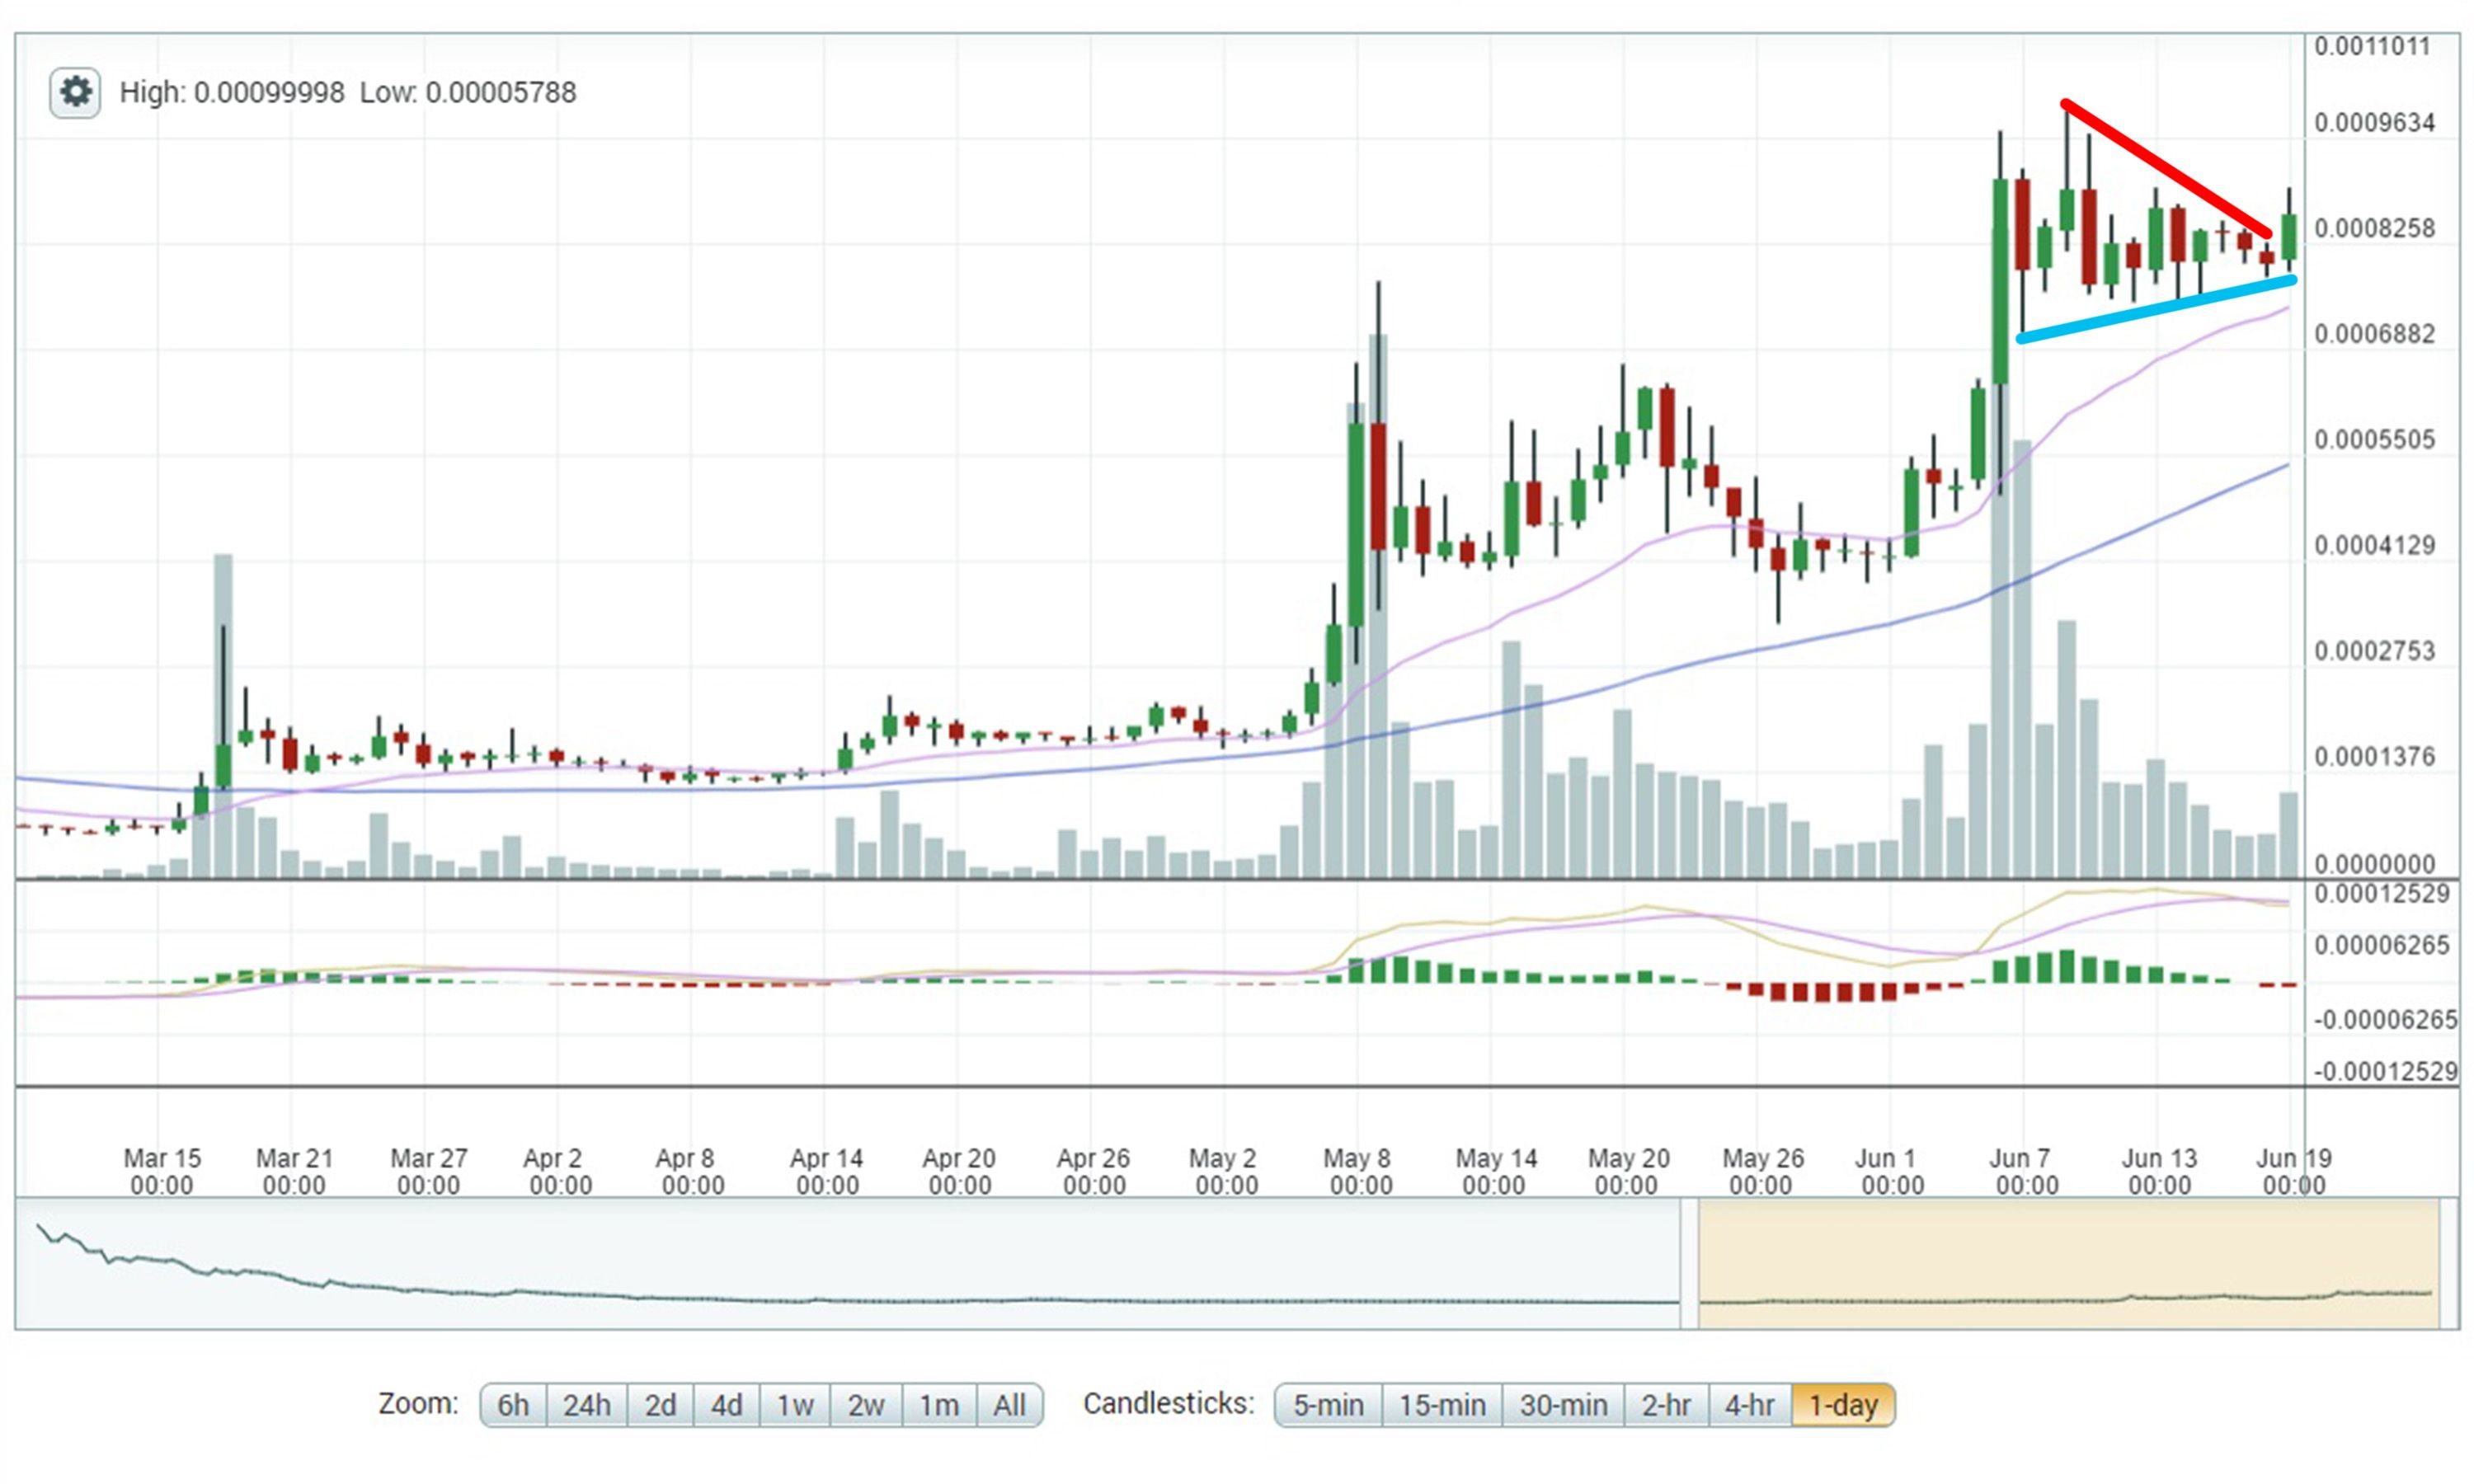
With the price trading mostly sideways over the past week, the 20-day moving average has had time to catch up, but prices are still trading well above the 50-day average. Lows have been trending slightly higher (blue line) and there was a relatively sharp short-term downtrend from recent highs right near 100K satoshis, but today's price action has firmly broken that trend. We may be seeing a pennant-like pattern forming, but may need more time for it to play out.
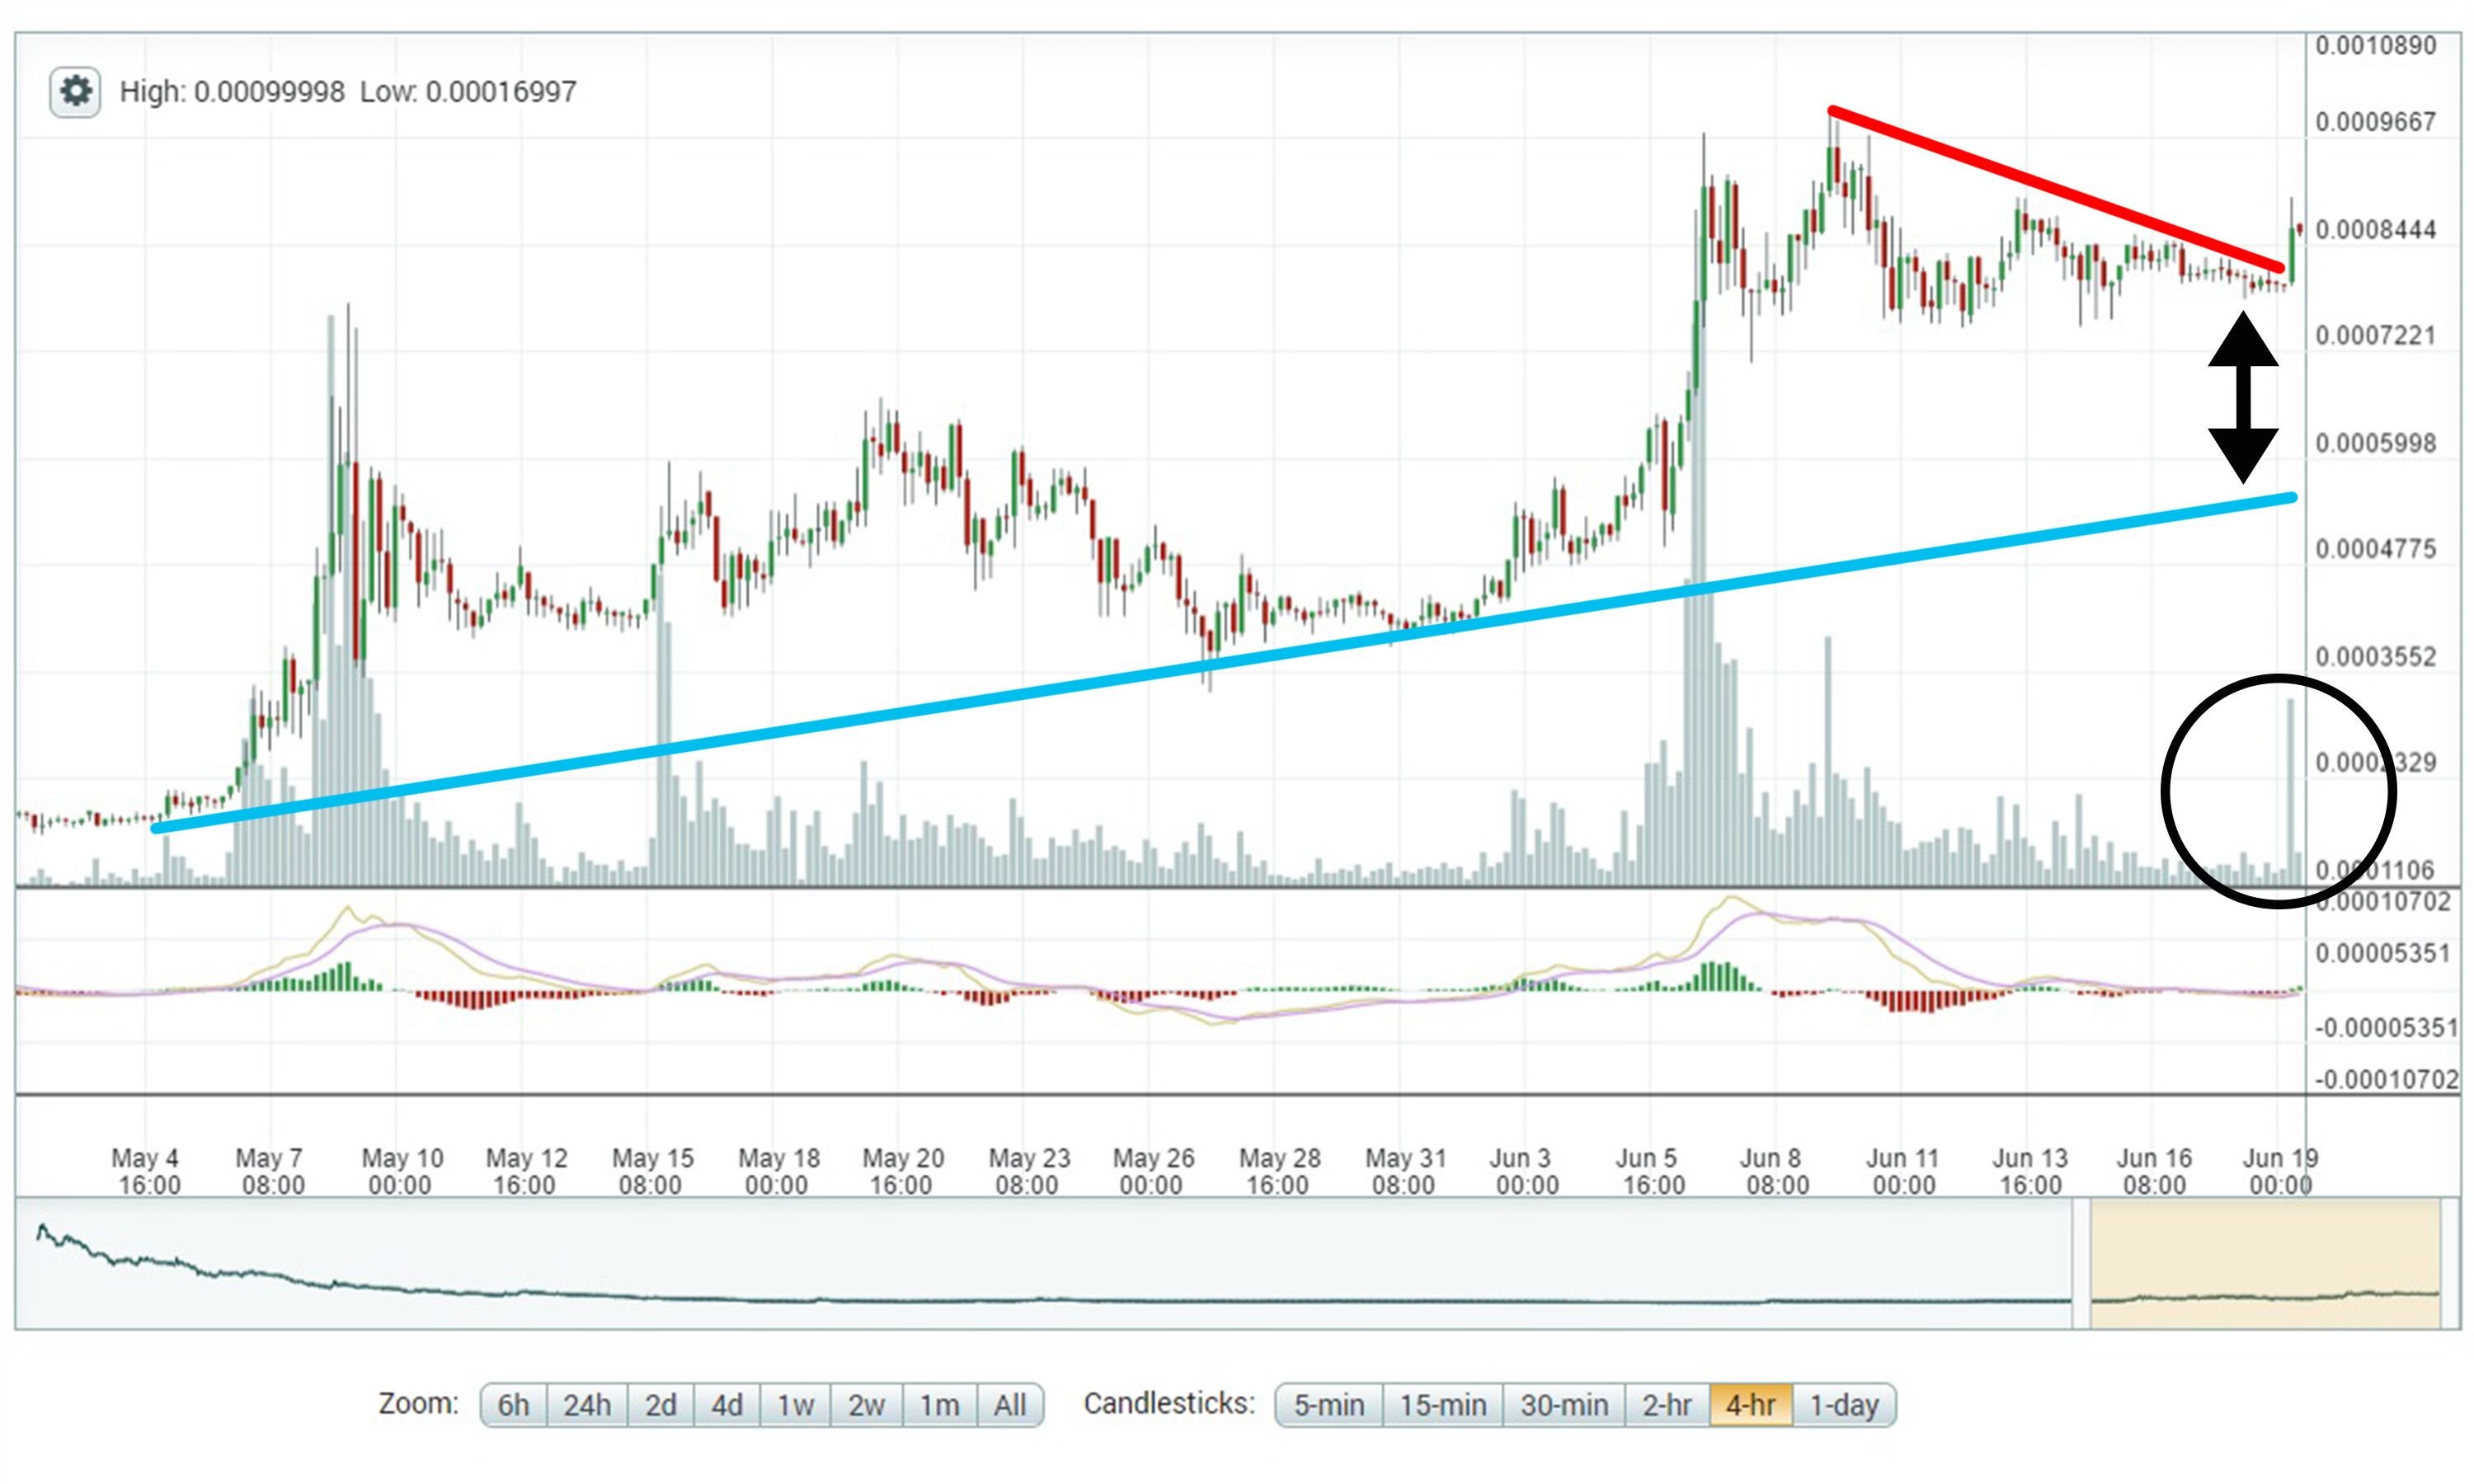
The STEEM-BTC price has a lot of wiggle-room between current prices and the uptrend line, but it doesn't appear to want to move below 75K in the near-term. With the convincing break of the downtrend line on a spike in volume, we could see prices test 90K again very soon and may not see another test of 75K satoshis in the near-term. We may see a new floor around 79-80K for now. Increasing volume and another push to 90K could help confirm this.
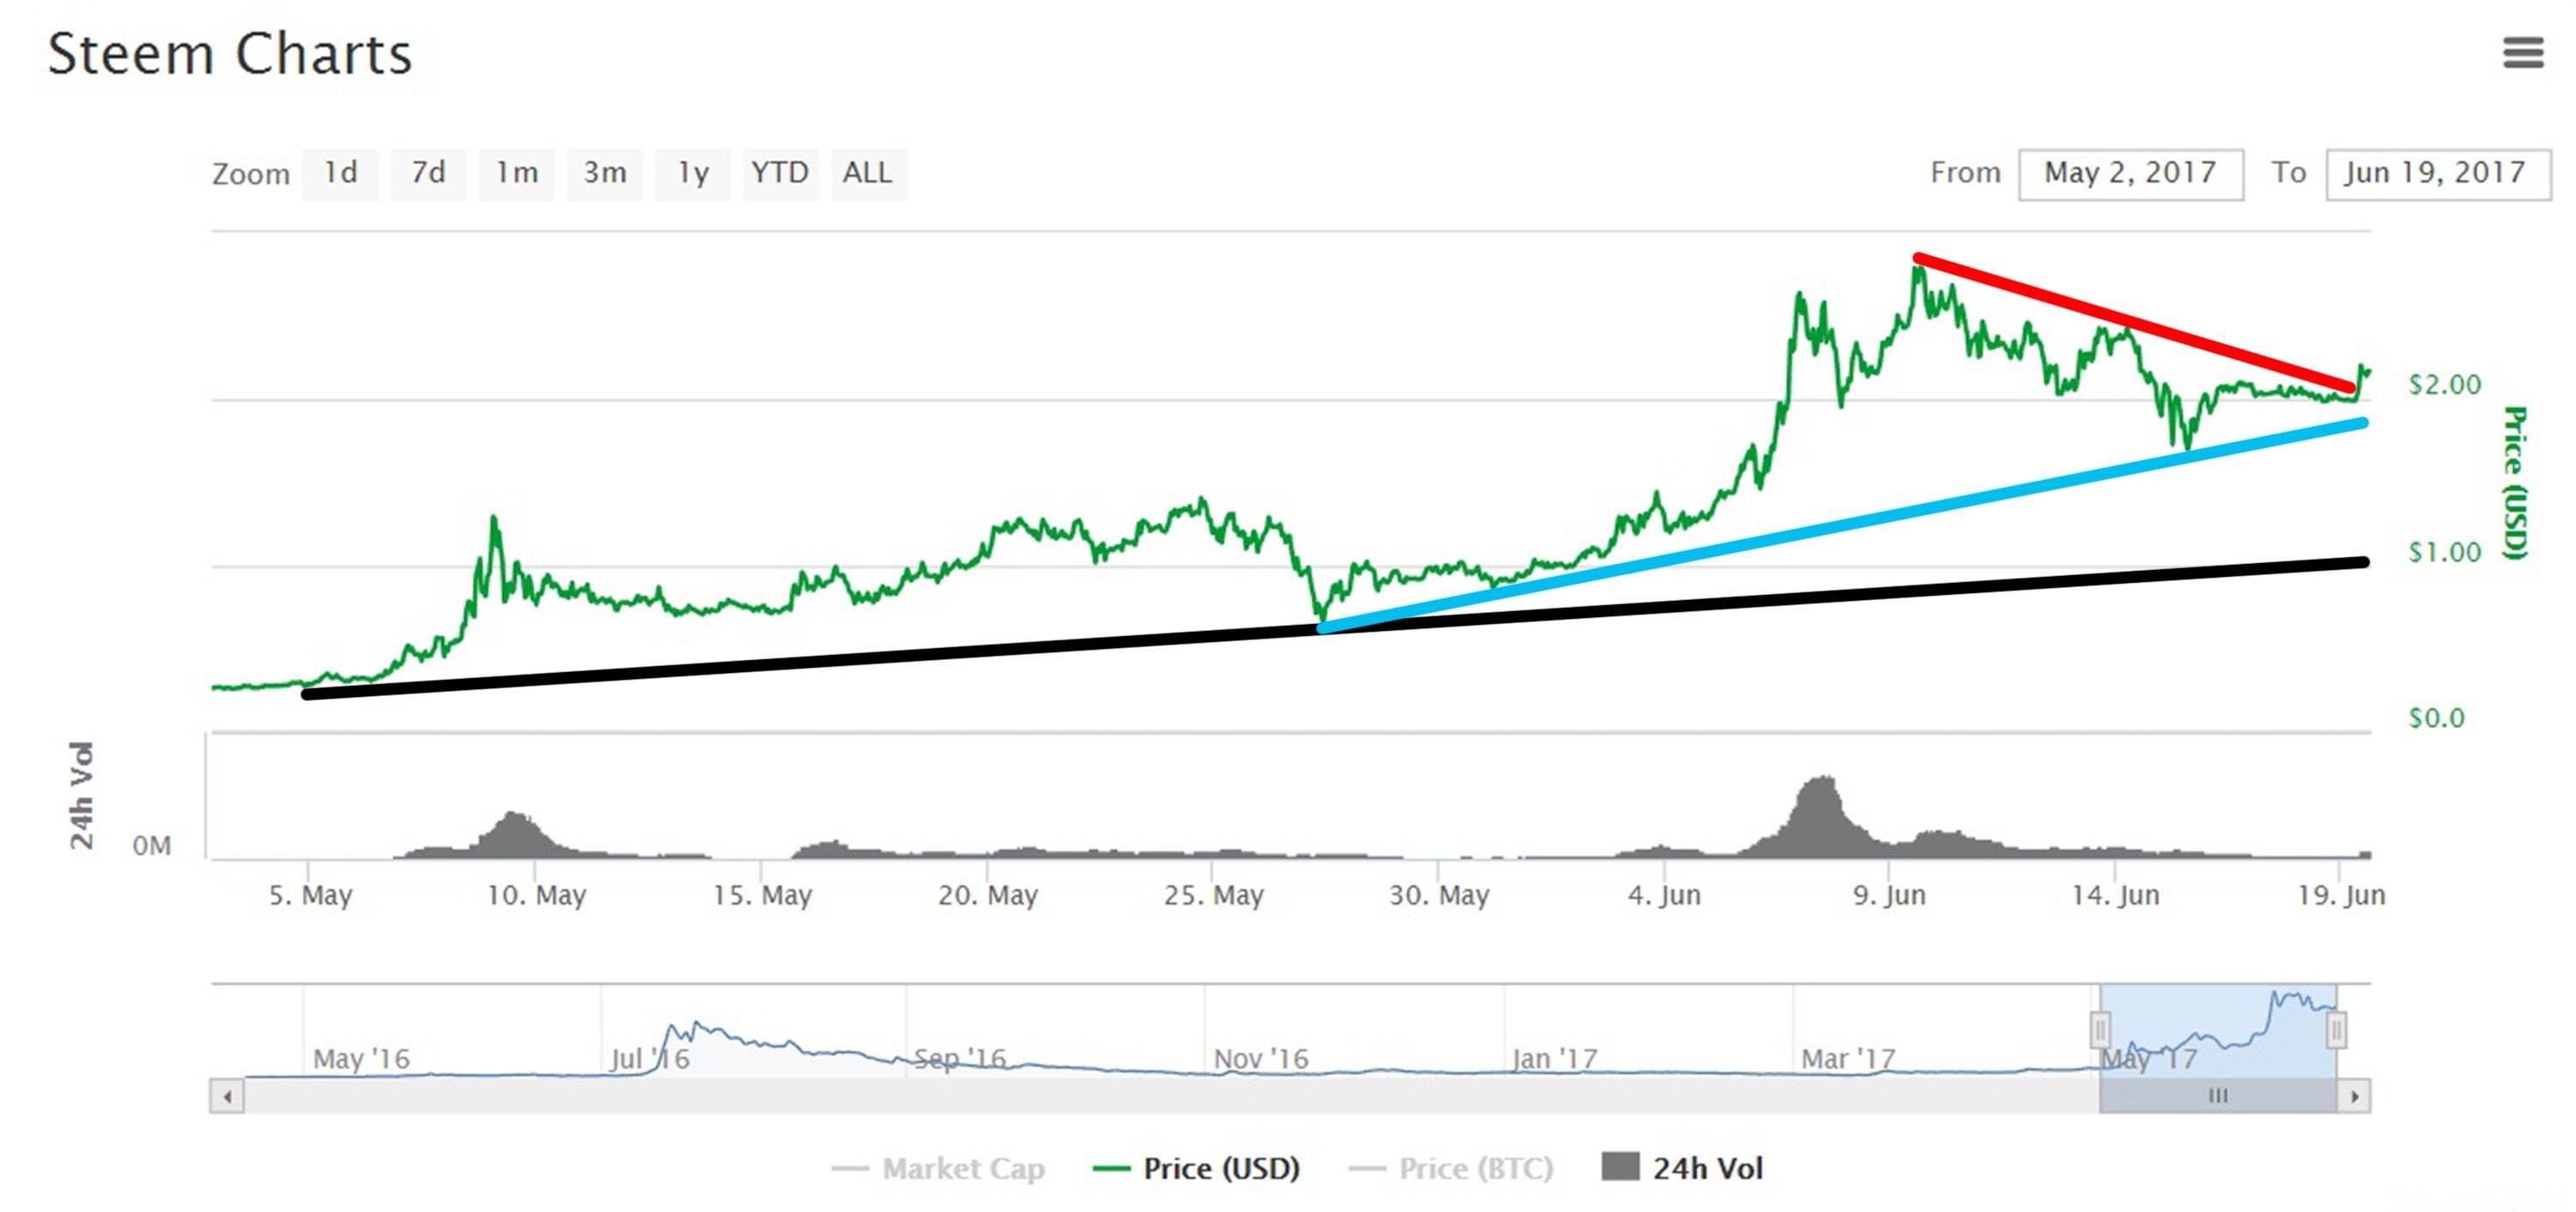
The STEEM-U.S. Dollar price is showing some slightly different results in terms of its recent support/uptrend due to Bitcoin prices. However, the long-term uptrend (black) and near-term uptrend (blue) are unchanged and remain strong. The price has also broken through the most recent downtrend line and has been trading back above $2.00 for the last few days after dipping below in the latter half of last week.
As long as Bitcoin prices don't take another dive, we should see $2.00 serve as fairly strong support for prices overall, which are still in a very bullish trend on long-term charts.
Where can prices go from here?
The STEEM-BTC price has been trading in a fairly narrow range but we may be seeing it currently push that range to the upside. Previously, 75K has been a strong support line, but that may be pushed up to 79-80K for now on any retreats below ~85K.
We can still see 90K as current resistance. If the price were to break through 90K, we could see a green light for another test at 100K satoshis, although there may be some work to do around 94-95K before moving to that larger test.
Continue watching that volume for confirmation of the moves. Recent trends have shown STEEM prices moving up on increased volume, so I would expect that to continue as long as prices remain in their bullish patterns.
Mid- to long-term buyers may want to start averaging in below 85K and possibly increase buying below 79-80K, depending on their risk appetite and goals.
Experienced, short-term traders may be able to trade the range between 85K and 90K with some success. A few quick 5-6% gains may be possible for now. (Not recommended for non-traders!)
If you're trading, always remember:
Never invest or trade what you cannot afford to lose and put tight stop-losses in when prices creep lower towards the support lines.
As always, if you have any critiques or comments about my non-professional analysis, please let me know. If you decide to trade this market, good luck to you!
Disclaimer: I am not a professional adviser and this info should not be used for trading. These are only my interpretations and opinions, and while I would be flattered that you think so highly of my fairly basic analysis, it would not be prudent to use this for transacting/trading with real money.
*Charts are from Poloniex and Coinmarketcap.com. Analysis is current as of approximately 12:45pm EST, June 19, 2017.