
The STEEM-BTC price broke it's most recent uptrend line and may stabilize in a previous trading range.
Over the last 24 hours, the STEEM-Bitcoin price fell through its support line at ~55K satoshis and dropped all the way down to a low of 45K satoshis before finding a temporary floor. Let's take a look at the charts and see where the current prices may be heading.
The first thing we can see on the chart below is the convergence of the downtrend line from the recent highs on May 8th and 9th and the uptrend line that began a few days earlier. A pennant was forming on the 2-week chart and trading volume was also declining.
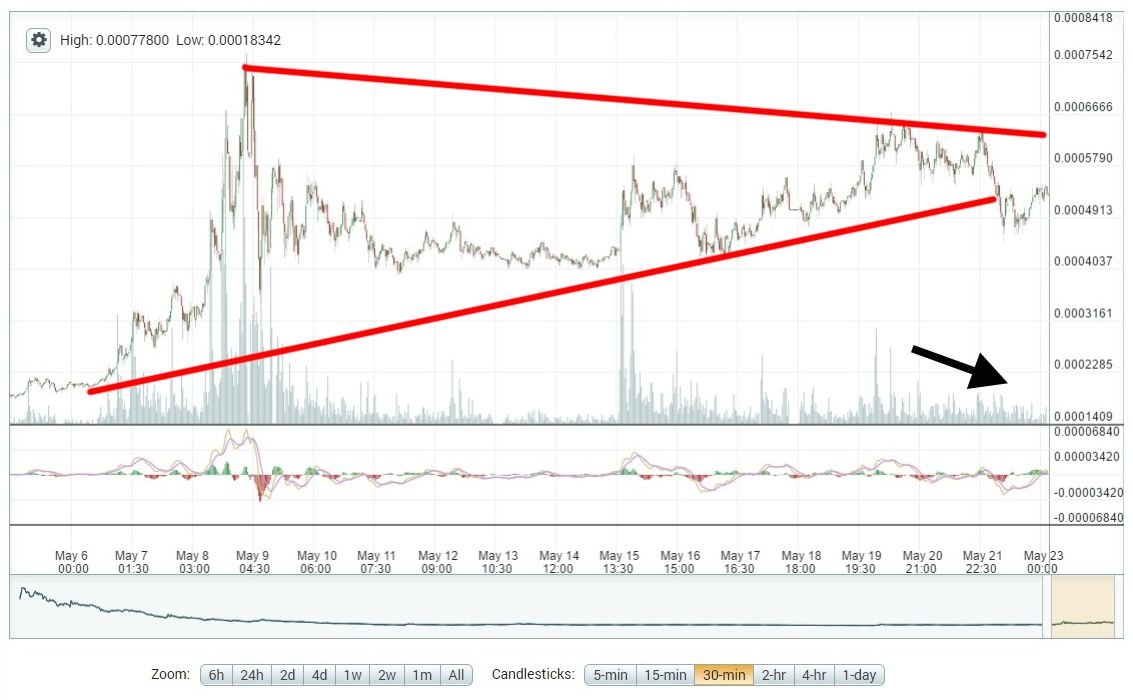
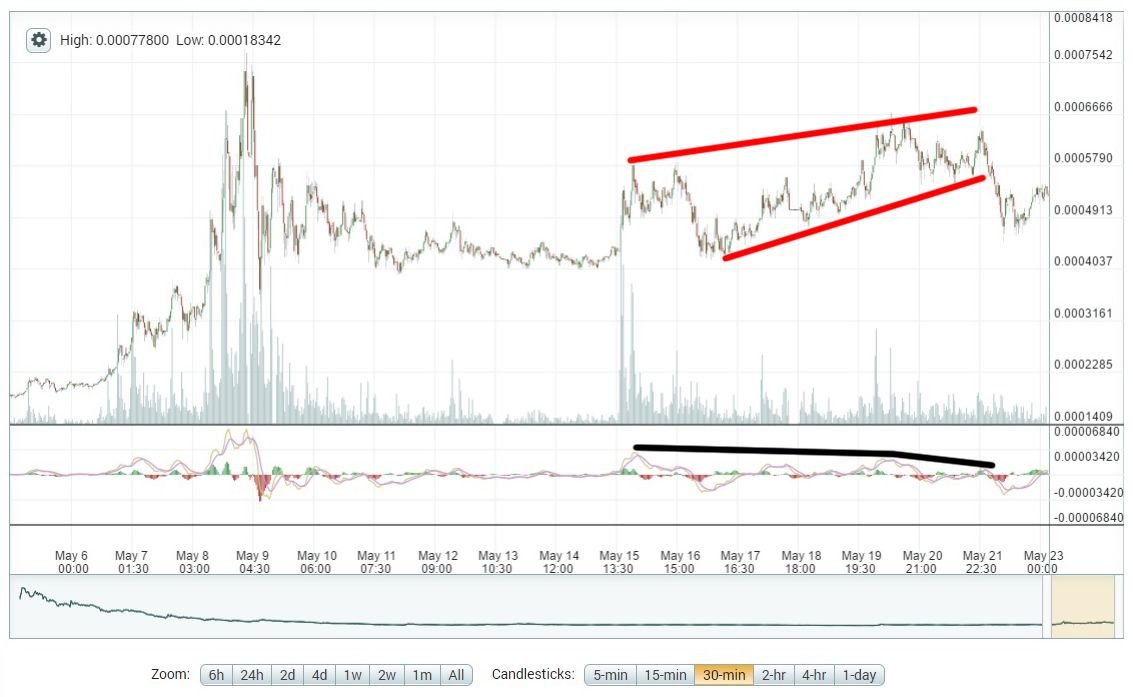
In addition, there was a slight rising wedge that was also forming over the past week. We can see that it's not very noticeable and can be easily missed. There was also negative divergence of momentum in the MACD (Moving Average Convergence Divergence). The combination of the rising wedge, the waning momentum, and the reduced volume set up the STEEM-BTC price for a fall.
With the price breaking through the uptrend line and support at ~55K satoshis, it dropped and found some support around 46-47K satoshis, which was one of our previous support/resistance lines. This line is still confirmed by the previous retracements from the price peak on May 8th and 9th. There have been several touches of this line on both the support and resistance side since that peak.
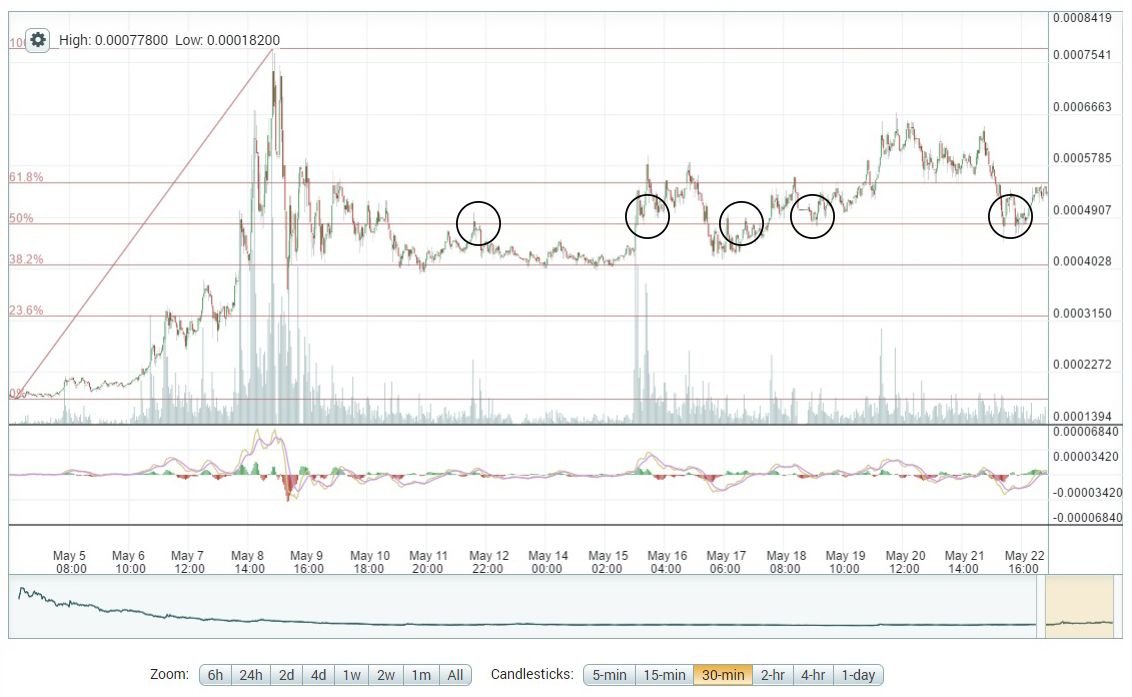
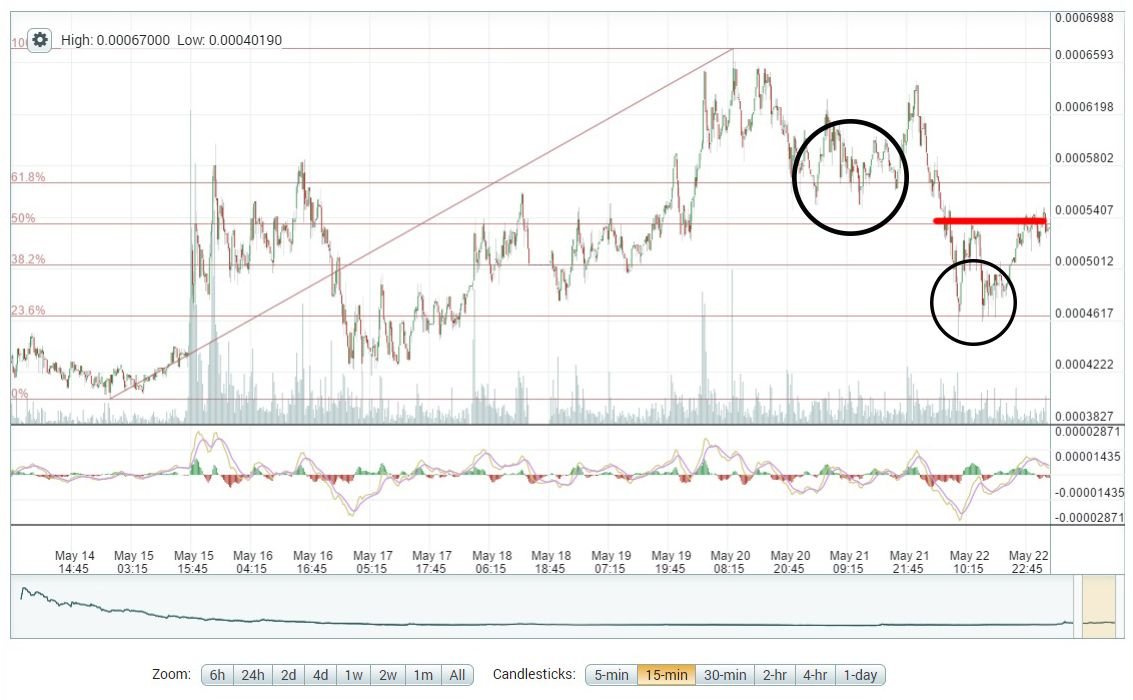
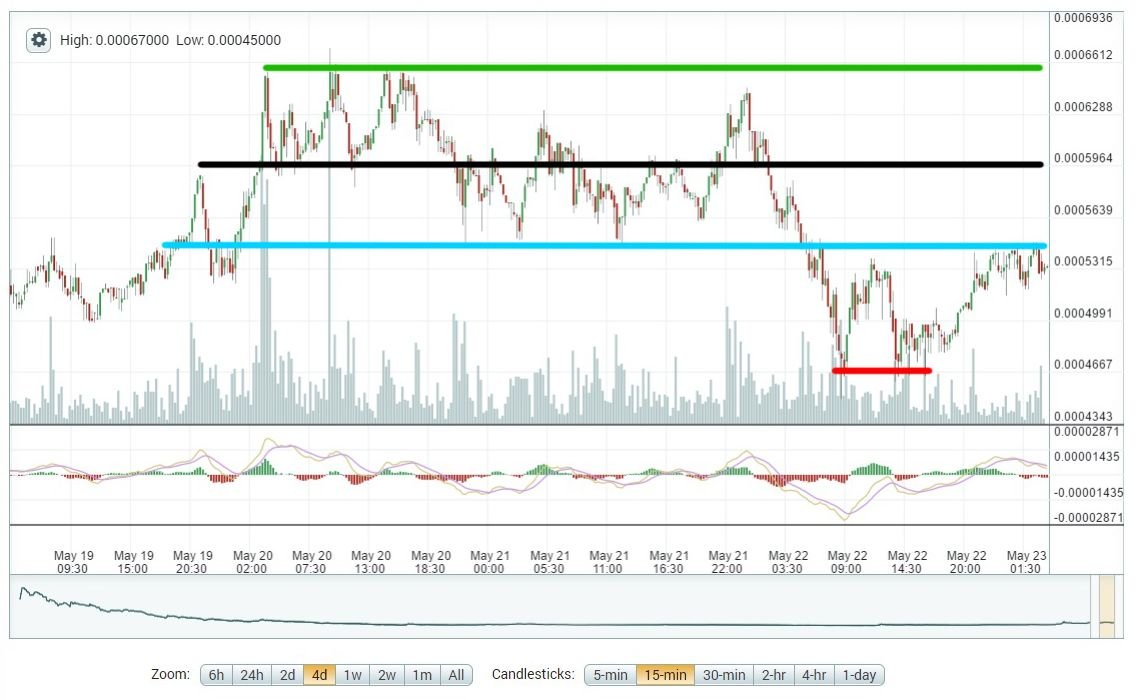
Fibonacci retracements from the most recent move also confirm some of the same support lines and price targets. The STEEM-BTC price is currently looking at some resistance around 53-54K satoshis (red line) and appears to have made a double-bottom at ~46.5K.
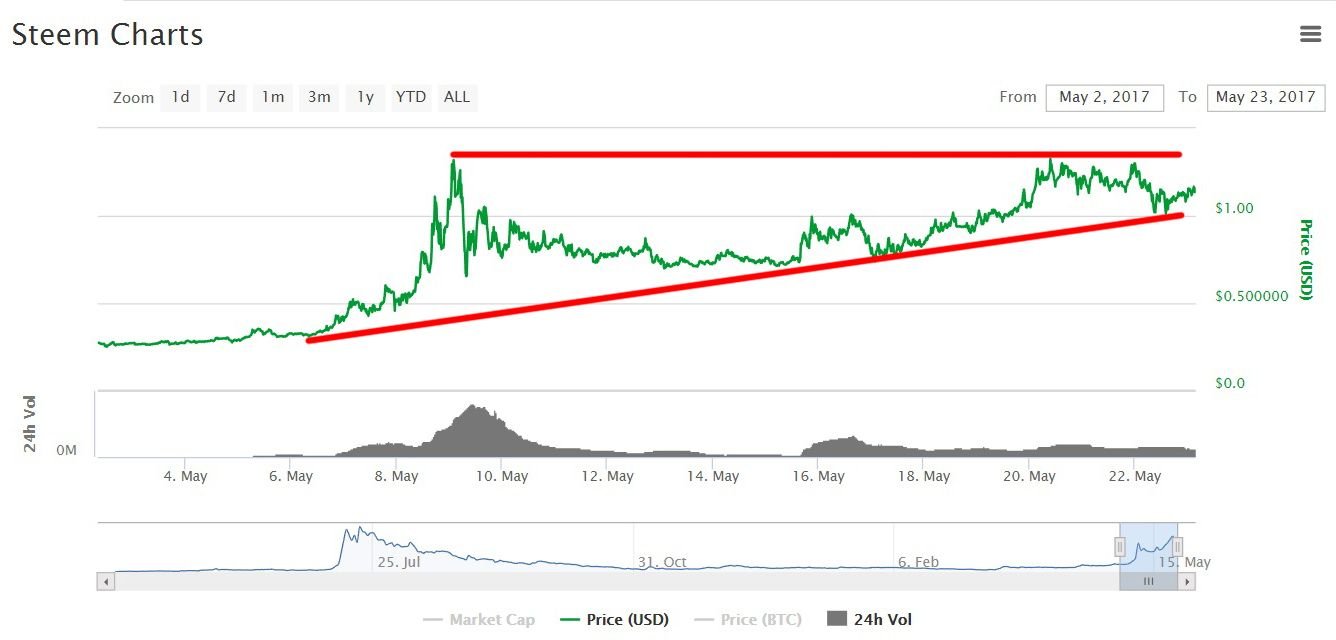
The STEEM-U.S. Dollar price has actually held its uptrend line, which could be a positive sign for prices in the near-term. It also appears to continue forming a bullish ascending triangle pattern that is being squeezed towards the highs around $1.30. The STEEM-U.S. Dollar price is currently $1.15 at the time of posting.
What can we expect for STEEM-BTC prices?
There has been a lot of volume moving into Bitcoin, Ethereum, Zcash, and Dash over the last couple of days. As long as this is occurring, I wouldn't expect too many large moves into other cryptocurrencies. And even though the STEEM-BTC price had fallen over 28% in one strong move downward, the price in U.S. Dollars didn't suffer much damage, continuing its upward trend.
If current STEEM-BTC prices have not hit their near-term floor at ~46K satoshis (red line, chart below), we could see another leg down to the 40-43K range. At the time of posting, there is some moderate support around 50K and stronger technical support at 46-47K. I wouldn't expect prices to fall under 46K unless there is an influx of new selling pressure for STEEM or a flurry of activity with the previously mentioned cryptocurrencies.
If the support line can hold, then the upside targets in the near-term would first come in at 54K (blue line), which is the current line of resistance.
If the price can break through 54K, then it will likely rise to 57K. At that point, the chart gets a little messy and the price can bounce around between 57 and 61K satoshis. A likely target for resistance in that range would be around 59-60K (black line).
If the price can gain some momentum and break 60-61K, then it shouldn't have much trouble finding 65-66K satoshis again (green line).
With surging BTC, ETH, and Zcash prices, rising back up to recent highs could be a formidable task for STEEM. I would look for a likely range between 46K and 58K satoshis over the next couple of days. This is a precarious place to put in any short-term trades without stop-losses. However, buying on the low side should be a good mid- to long-term entry point if you're bullish on STEEM prices.
If you're trading, always remember:
Never invest or trade what you cannot afford to lose and put tight stop-losses in when prices creep lower towards the support lines.
As always, if you have any critiques or comments about my non-professional analysis, please let me know. If you decide to trade this market, good luck to you!
Disclaimer: I am not a professional adviser and this info should not be used for trading. These are only my interpretations and opinions, and while I would be flattered that you think so highly of my fairly basic analysis, it would not be prudent to use this for transacting/trading with real money.
*Charts are from Poloniex and Coinmarketcap.com. Analysis is current as of approximately 1:45am EST, May 23, 2017.