Hello everyone, some of you may know me by my nickname OZmaster,
well I opened this account in order to post Technical Analysis and decided to start of with #STEEM, seems appropriate ;)
So let's begin,
The following are charts from the Bittrex exchange,as it has the longest history i decided to take that one, after each chart(picture) will come a comment with explanation. Before each chart I will make a "legend" with the goal of the community having it easier to understand.
Legend
(LGDL)Light green dashed lines - "old" high's which should act as support
(LBDL)Light blue dashed lines - "recent" high's which should act as support
(PDL)Purple dashed lines - "recent" low's which should act as resistance
(PYL)Pointy yellow line -bottom part of recently broken triangle border
(YL)Yellow lines - "current" holding triangle borders
(RL)Red line - All Time High (ATH)
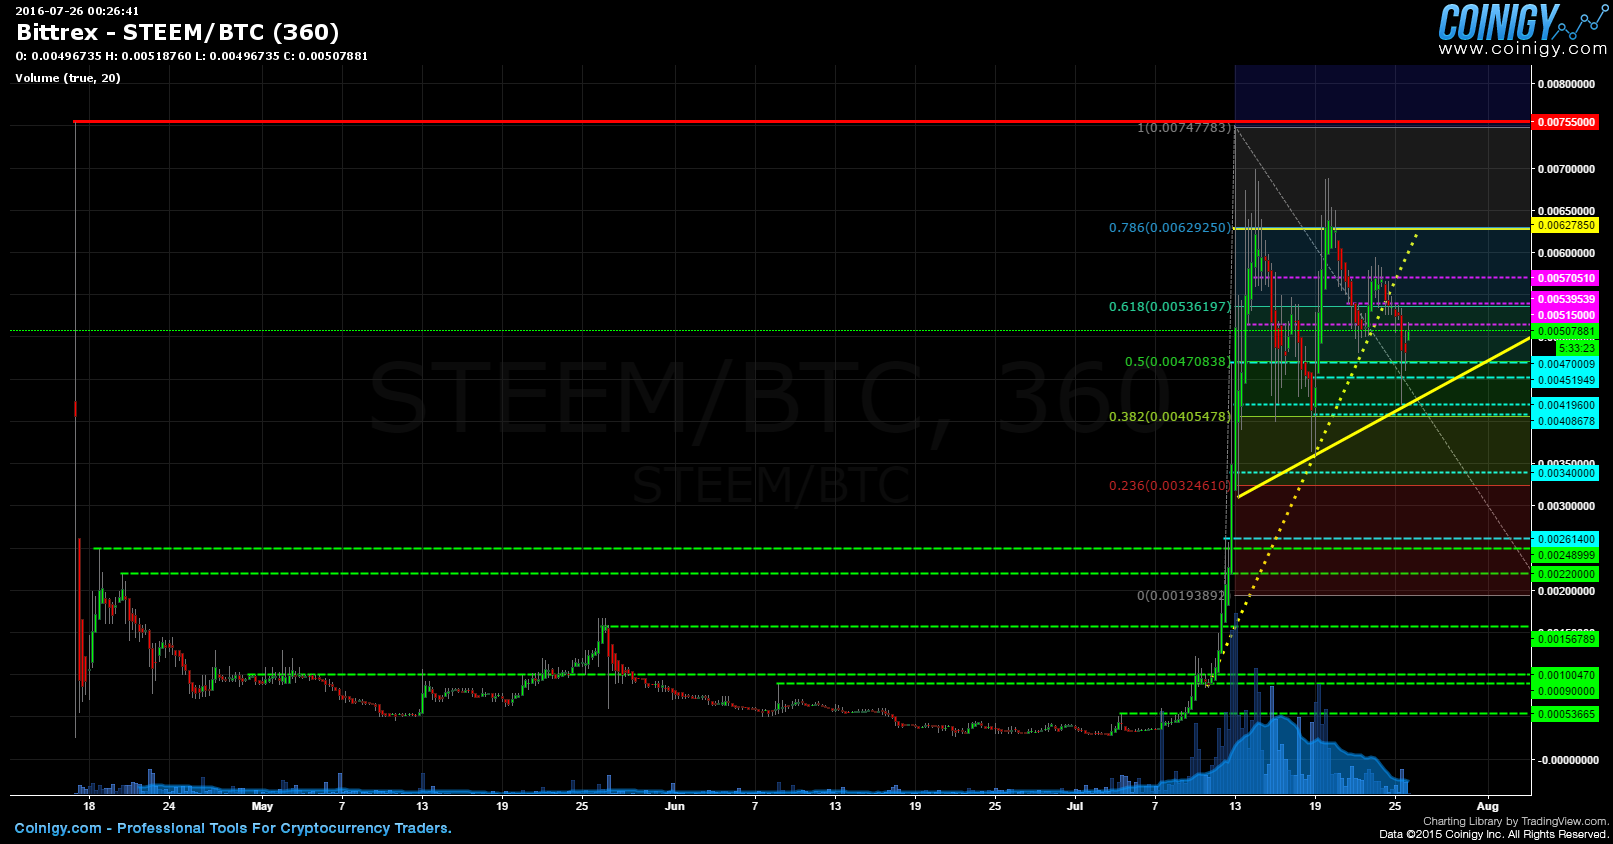
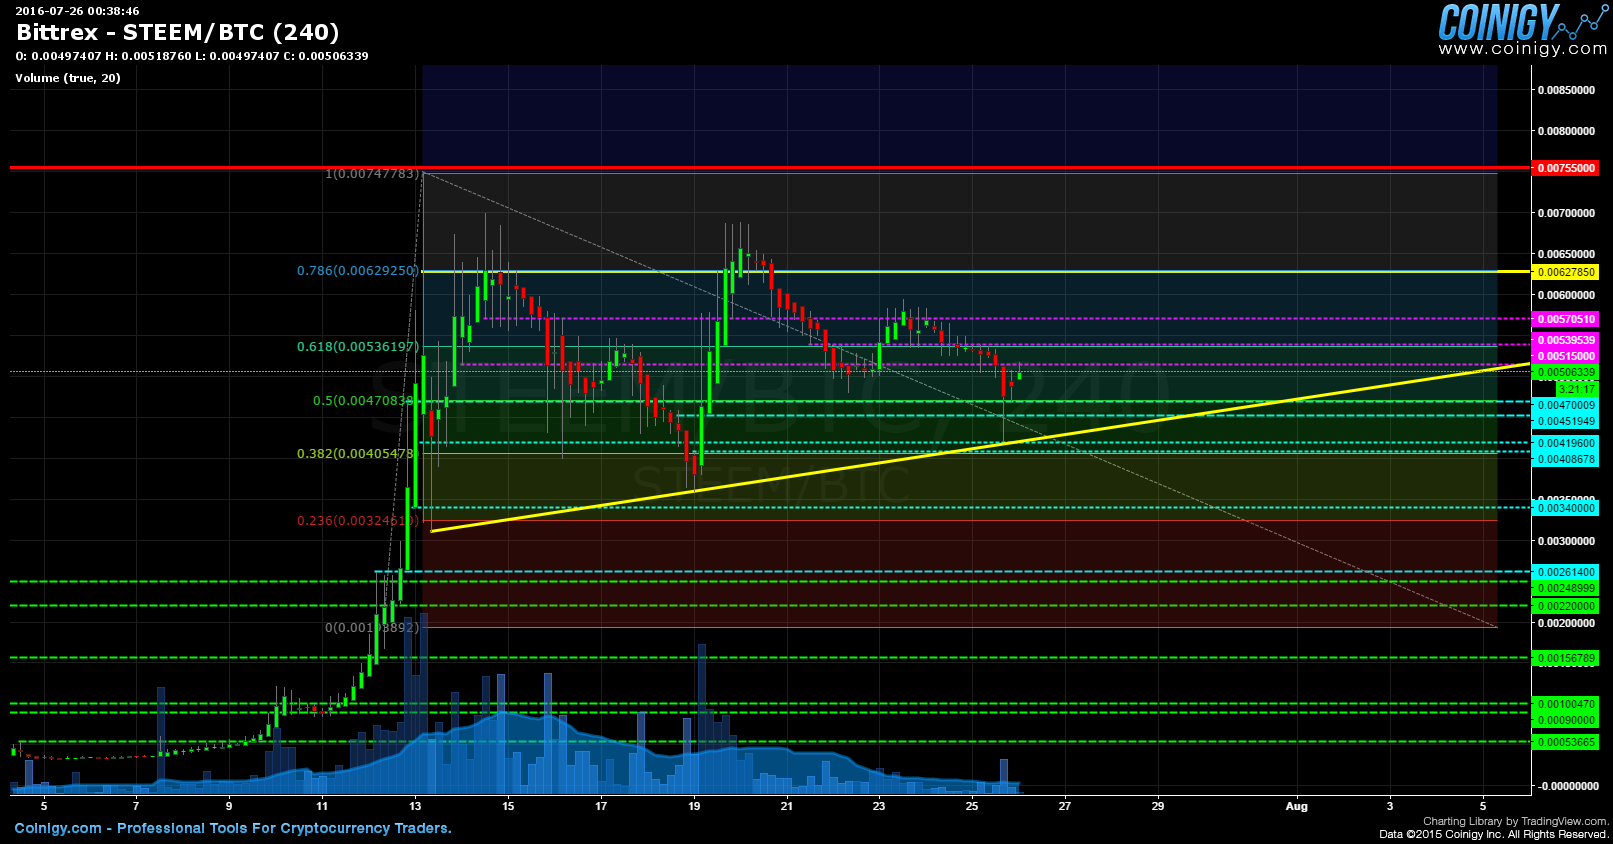
So here we have the full history of STEEM/BTC, first I want you to get an overview of the whole chart as well as the areas I will talk about.
As you can see i marked some tops/highs from before Jul(LGDL), those are "old" support lines(rather zones around those prices) where there is buy support to be expected on the order book, however those are "old" high's, high's which were made before the big pump accured.
A little bit above and to the right of the LGDL u can see the LBDL , those are the "recent" high's, the ones that are important for the trading range we are in right now.
Above the LBDL you can see the PLD, those are "recent" low's, the resistance lines in the trading range atm, around those lines the price has a higher chance of repelling back down.
PYL is the recently broken border of the triangle which resulted in the price going downwards as seen on picture.
YL are the border lines of the current triangle, meaning the price is expected to respect those lines and bounce of from them, breaking up or down with a hard move towards the end.
The RD is the All Time High line, at this point this is the highest and strongest resistance point ever reached by STEEM.
I'm gonna leave the LGDL and the time before July 10th for later and focus on the current situation, but will shortly get back to them later.
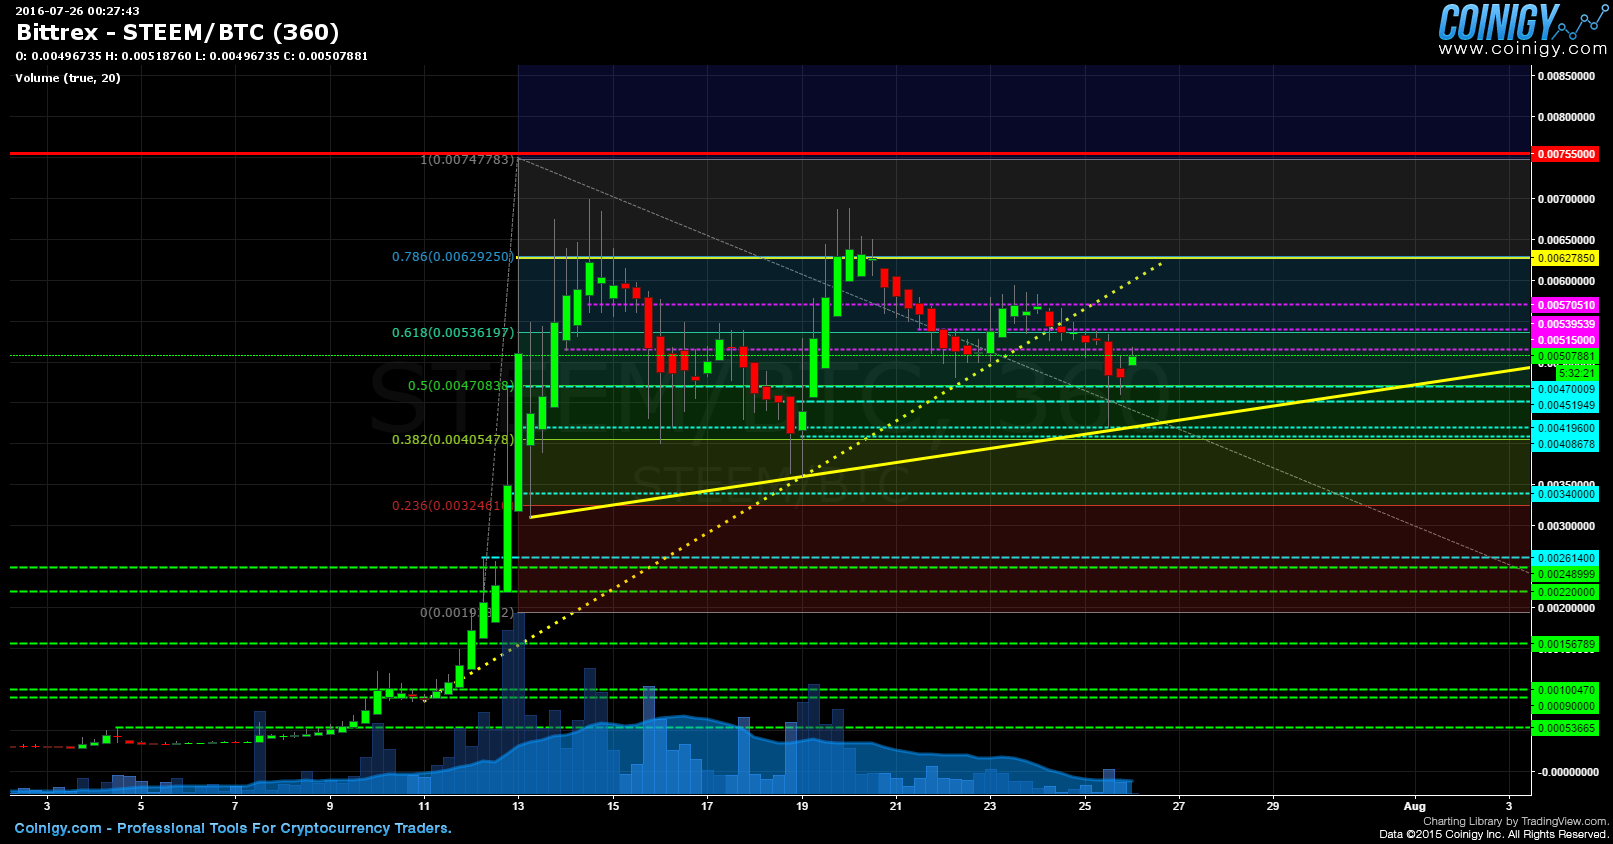
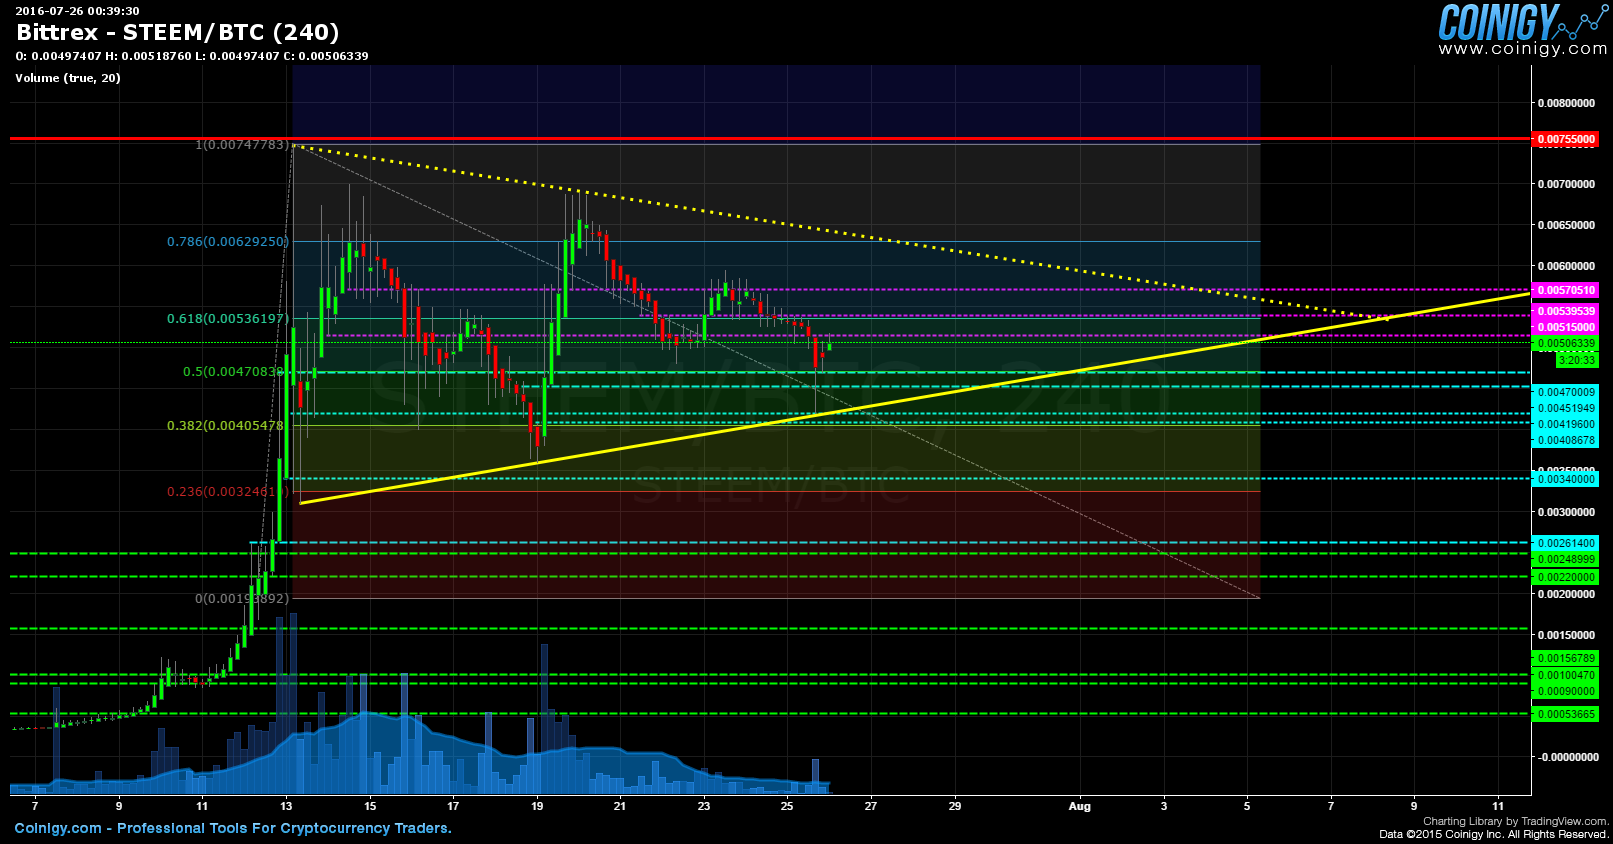
Now let's take a closer look to the time period from July 10th onward. Below you will see 2 identical charts, one with 6 hour candle's and one with 4 hour candle's, starting off with the 6 hour one.
(6h chart)
(4h chart)
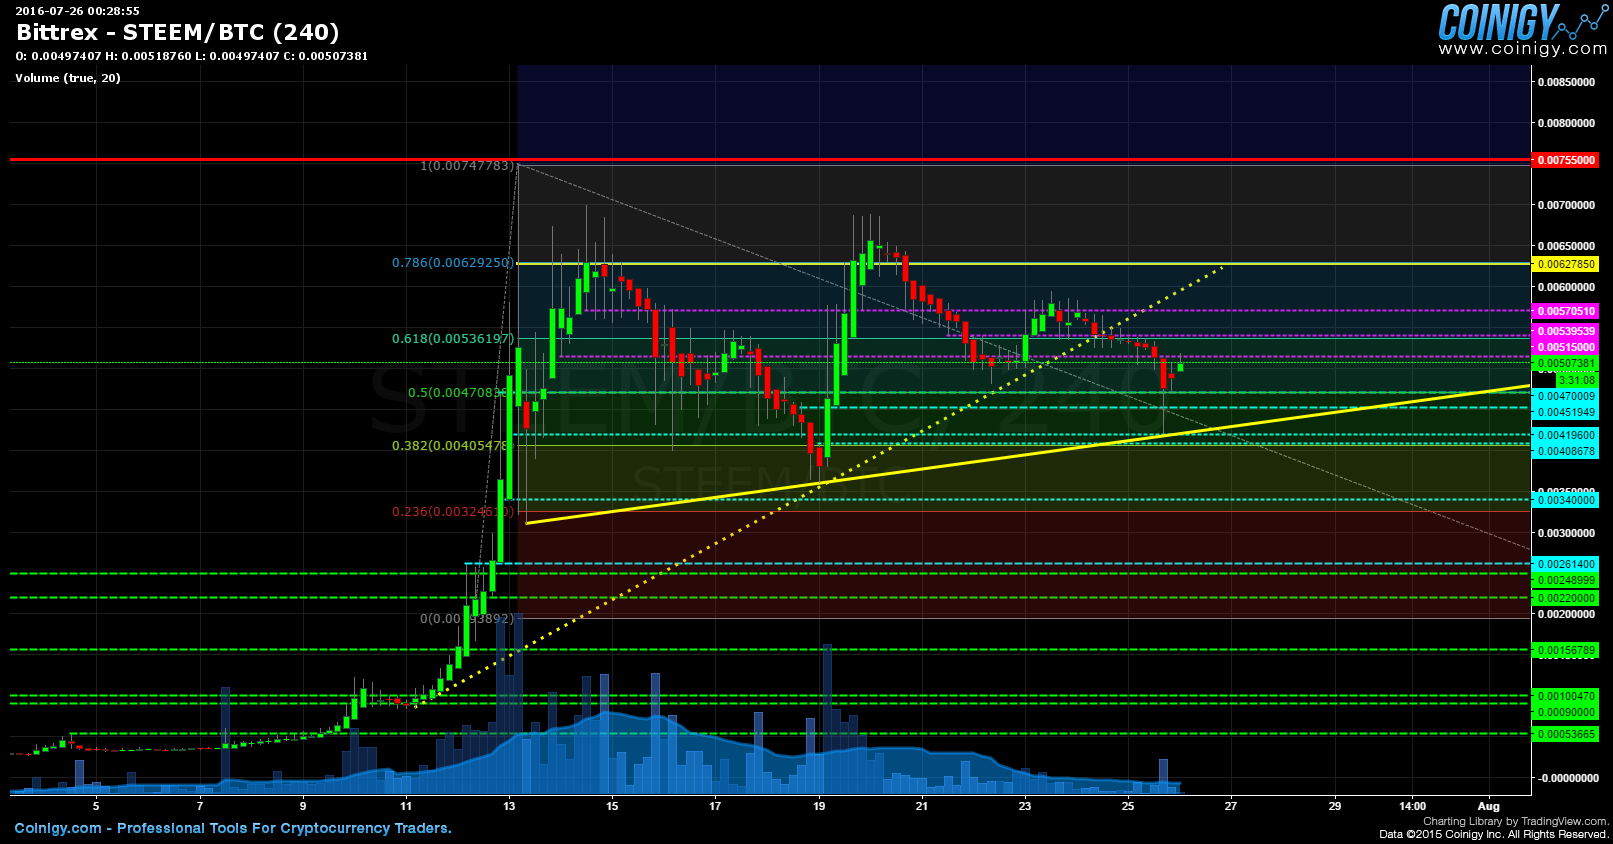
There is nothing much to comment no those chart's, just analyze them for a few minutes,get a feeling of where we are at in the market right now, you will see how the price "respects" the YL triangle borders, those are the "main" one so to say, using the other lines to slowly direct the trend.
In the coming 2 pictures I will explain the bullish as well as the bearish scenario
1.) Bullish scenario
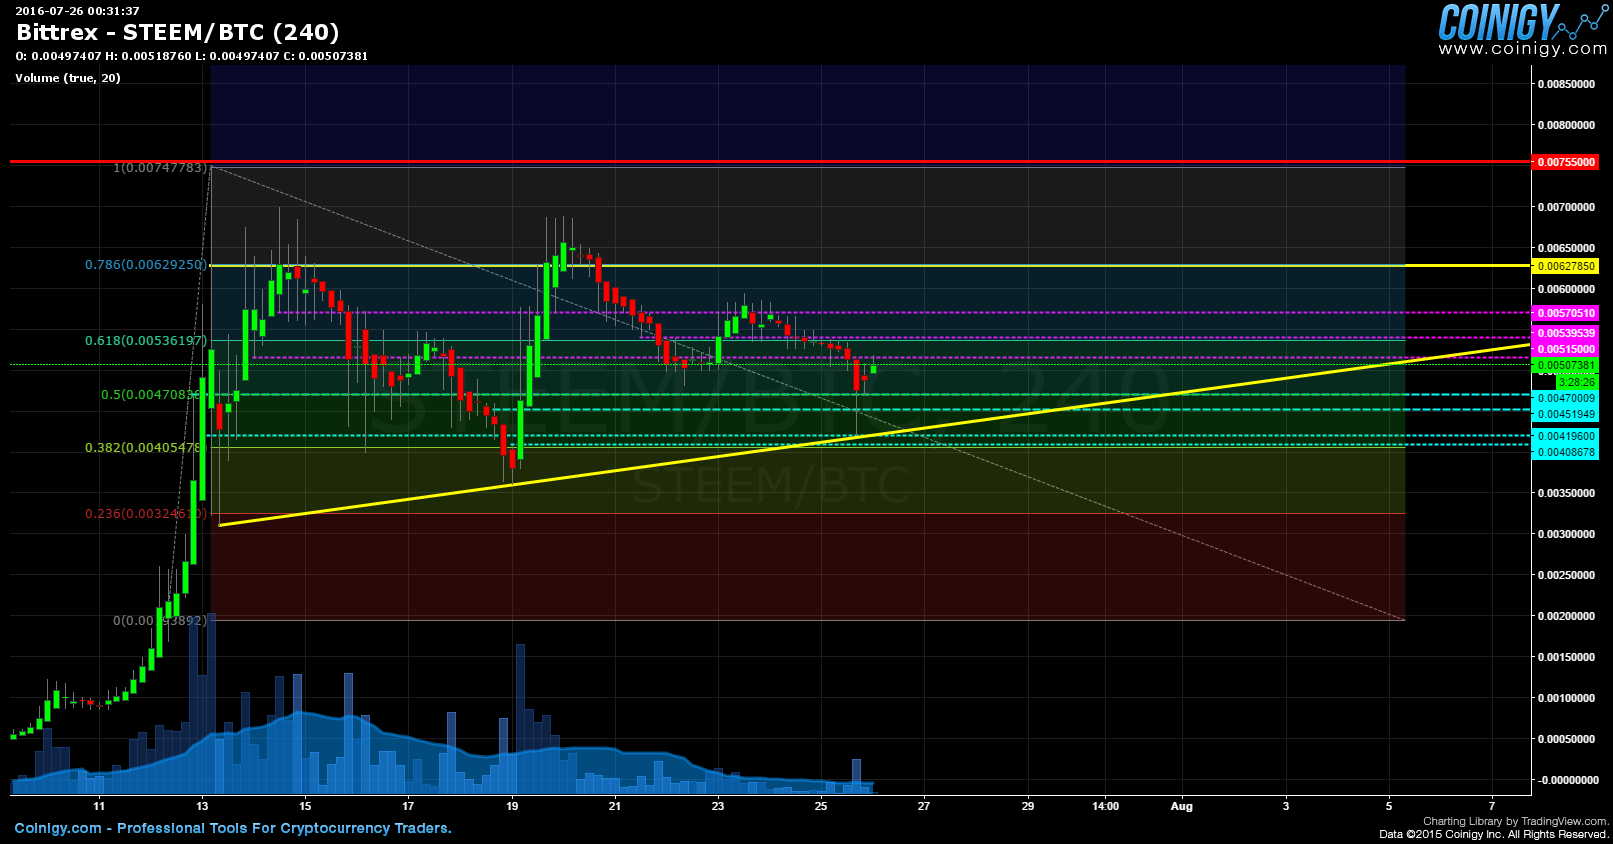
As you can see I deleted the LGDL and one (last/lowest) LBDL, raeson being is that I am going to explain the bullish scenario, aka the price going up.
The price keeps trading between the 2 YL borders, refusing to break down, using the LBDL's and later possibly also the PDL's as support points.
Slowly progressing upwards the price will tackle the upper YL border, if there is a successful break, we can expect and immediate attack on the RD All Time High (as there is no significant historical resistance nor support in between), most likely breaking it, making a new ATH, and setting a new floor on the top YL border.
2) Bearish scenario
The price breaks the bottom YL borderline and makes a new low at around ~0.034 LBDL, IF the mentioned LBDL doesn't hold the price is likely to break down towards the last LBDL and even down into the LGDL, as the price pump after July 11th was hard and the price was climbing hard without backing down there is no strong support level in between the 0.0034 LBDL and the 0.0015 LGDL.
BONUS CHART
another possible form of the triangle, indicating the possibility that the price will trade towards the end of that triangle before making a decision of going up or down.
BONUS COMMENT
$STEEM is somewhat special, and therefor accurate predicting of it's price going up or down sharply in the near future is quite hard, the reason of all that being the business model behind the whole platform, STEEM, SBD and STEEM POWER. If the business model is good it can totally ignore every law of TA. I will write a whole post on that matter in the near future!
If anyone has any questions or need's help fell free to ask, I will try to explain as fast and as best as I can.
Critics, comments, reply's, counters, advice's, etc,,, are always welcome!
Have my charts helped you in any way?
Are there more people who are doing TA?
Disclaimer I am showing multiple scenario's on the price movement, in the post it'self I do not take any stance, either bullish or bearish. I am not responsible for either you're winning nor you're losses upon trading!
Kind Regards, OZ :)