
A few months back I posted about a creating a Contribution Score that would score STEEM Accounts with a value based on engagement and activity on the block. An alternative to reputation and a way of finding highly engaged people on the block. Since then I have been researching different theory’s that could be used to create this score with data from the block and testing some data to see what is possible.
After a positive reaction to the first post, and some further positive discussions on discord, I would like to present to you the concept of Contribution Score(CS).
Take @abh12345 engagement league (which has been proven to increase retention on the platform); now let’s add a load more data points.
Next, we need to weight the data points. This is very subjective, but what if we could use a ML algorithm that would best decide how to weight these?
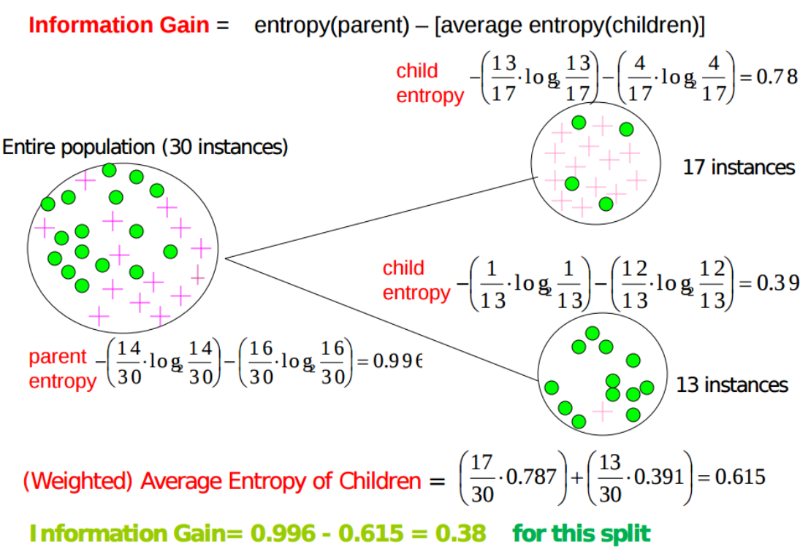
Introducing Communication Theory/Information Theory and Entropy with Information Gain.
This theory is often used in decision trees to establish the most accurate and efficient route to take. A decision tree is a set of questions used to filter information allowing you make a more informed decision. It is commonly applied by banks when approving credit or loans.
Entropy is a direct measure of the "amount of information" in a variable. This all boils down to a mathematical way of calculating information measured in bits. Once the noise has been filtered, the more bits of information something provides, the more valuable it is. The aim of the algorithm is to find accounts on Steemit that are highly engaged with the platform and that contribute the most in terms of both content and curation.
Let me try and explain how it works.
For those interested in the theory and math involved check out this article and scroll down to Entropy and Information gain.
/@theexcelclub/understanding-machine-learning-and-how-algorithms-work
Applying this to Steemit we can take accounts and see how much information they give and how much information they received. By taking enough data points that will measure both information given and information received we should be able to highly reduce the scores of spam accounts as they tend to send out information more than they receive it.
The information gain from each data point is measured and this is used to calculate the weighting of each of the data points. All calculations are based on probabilities and so the sum of all the final scores should and does = 1
If we look at the number of Root posts per author for example, the probability for each observation/Steemit account would be their count of posts/total post count. This is the probability that they will provide the next post on Steemit.
Once we have the probabilities, we can then calculate the entropy for each observation. To keep the entropy between 0 and 1 for the data point, I have used a Log to the count of accounts.
From the entropy we can then calculate the information gain. In a decision tree, this would decide the next step. However, if we use the information gain to calculate an information gain probability, this can be used to weight the probabilities from each data point removing the subjectivity.
The total score is the sum of the probabilities*information gain probability.
I have carried out some sample workings in Excel, although Excel is not made for big data, I have pushed on as far as I can go in terms of file size and file usability. The table below shows the data points that I wanted to try this with. The fields in Green are as far as I have gone.

As you can see I currently have include more ‘information given’ data points than ‘information received’. As bots/autoresponders/spam accounts give information on a greater scale than receiving it, that means the test model does not do much to reduce the score on these type of account. However, by adding the additional data points we should see a great change in the score.
I am happy to share my current workings, but please be mindful that this is not a complete model as it is missing to many data points and lacks vigorous testing and used sample data.
The file, linked to below, has a worksheet for inputs, this feeds to the probability calculations sheet, then feeds to the entropy working and then the information gain sheet. The information gain probabilities on this sheet feeds to the scores workings sheet, which is also linked to the probabilities sheet. You will find the final scores, ranked in the score sheet sorted worksheet. The names highlighted in yellow are the top 10 accounts on Ashers league.
This is iteration 1 for the last 14 days, a second iteration is needed for days 15-28. The weighting on the scores would be based on the information gain from each time period. These durations are not set, just what I was using to start with. Other durations should also be tested.
You can access the excel file here to get an understanding of the calculations. However, building further on this model in excel is a waste of time as there is already over 4.5M and this workbook is now way to slow for me to proceed.
Now I need to work with someone to run this in code with all the data points listed and many more so we can test it and work on improving it. As an example, In my testing I have used count of comments. A better result may be achieved using count of unique comments as people often copy/paste comments and spam comments are often repeats.
You can view the excel file here:
https://www.dropbox.com/s/povlxr4wxt6x1cj/C_score%20workings_2.xlsx?dl=0