Warning....Incoming Good News.....
Churn is a fact of life in business. You will win new users and you will lose users. Churn can be calculated by the following formula
Churn = Number of Active users at the beginning of the period + New registrations – Number of Active users at the end of the period.
Churn rate can be calculated using
Churn rate = Churn / Number of Active users at the beginning of the period
“While churn is not necessarily a bad thing for all businesses, a high churn rate compared to your competitors can be a troubling sign. For social media and advertising platforms, it can suggest a lack of engagement and loyalty among the user base – and increased consumer dissatisfaction with the platform at large. Especially for companies that rely on advertising revenue, the lack of a consistent, engaged audience could jeopardize key business models and monetization strategies.”

Source https://www.vertoanalytics.com/chart-week-social-media-networks-churn/
Repository
https://github.com/steemit/condenser
Aim of Analysis
The aim of this analysis is to calculated the churn rate on Steemit for Q2 of 2018 and compare this to Q1. You can view the Q1 Churn report here
/@paulag/steemit-churn-rates-q1-2018
All data for this analysis was taken from Steemsql held and managed by @arcange. As to not distract from the data, I will first present the findings and then the queries used.
Weekly Churn Q2

The table above shows the number of new accounts registered per week, the distinct count of votes, the discount of authors, the distinct user count (either voted or posted/commented), the weekly churn and the weekly churn rate.
The churn rate varies considerably from week to week as it is dependent on two variables. The distinct users and The number of new accounts. As both of these variables vary from week to week it is expected to see this variation reflected in the churn rates.
In Q1 the average weekly churn rate was 22% and the median was 20%. Q2 the average weekly churn reduced to 14% and the median 13.7%
Monthly Churn 2018

As with the weekly churn rates you would expect to see a variance on the monthly churn rates as the variable also change. the number of new accounts registered each month droped considerably from Jan to June(76%). However the distinct user is smoother when looked at monthly over weekly and from Jan to June has only reduced by 30%. On a monthly basis this has resulted in a churn rate drop from 68% in Jan to 35% in June.
Both the average and the median monthly churn rates for the first 4 months was 59% and for the first 6 months this has reduced to 52%
Quarterly Churn Rates
In Q1 of 2018 Steemit lost more active users than gained. The churn rate was 121%
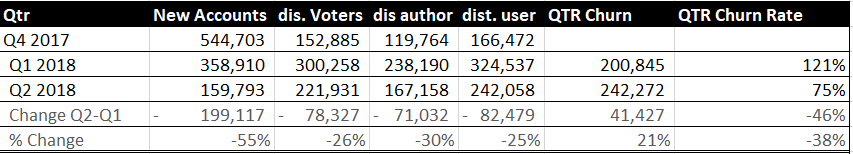
Q2 churn rate has reduced to 75%.
Using this as a comparative figure against the social media sites in the image above. Facebook was reporting a churn rate Q3 to Q4 of only 2.8%, Snapchat 23.5%, Instagram 19.1%, Twitter 25.3% and Kick 33%. I was unable to source more recent data and I was also unable to source churn rates for Reddit. If you do have this information, please do comment below as it would add value to this post.
Specific Churn Rates
In a previous request from @davemccoy he asked that I calculated churn using the following
"active users" as those members that post or comment in the preceding 2 week period of time
Calculating churn rates this was results in a higher monthly churn, with January showing that Steemit lost more active users than gained. However come June, we can see a notable reduction in churn.

Conclusion
Churn is a fact of any business. What is an acceptable level of churn is also a business choice but the reality is, the lower this number the better. Calculating monthly churn in both ways as above show that Steemit has a monthly churn of between 35% and 48% for June. This is a vast improvement on earlier months this year. A Q1 churn rate of 121% was very disappointing to see. 75% qtr churn is such a massive improvement.
The biggest factor is the reduced number of new accounts signing up. 55% less accounts in Q2 over Q1. There was only 25% less distinct accounts active.
What are your thoughts on the churn rates above? What reflection do they give about Steemit? Please do comment below
My thoughts - An Opportunity
My thoughts on this are rather positivist and I expect Q3 will show further reductions in churn. The are many project and initiatives ran on and off the chain that are working hard towards improving retention, such as the League of Excellence by @abh12345 and the work done by @meno with @helpie and @aggroed with #msp.
I also feel the Dapps are contributing to this decrease in churn, as these high SP accounts allow for focused curation. I think it would be worth analyzing churn on the Dapps, but that was outside the scope of this analysis.
I think the lower number of accounts is a good thing. Not only does it have a major impact on churn, but it also gives us a more manageable intake for on boarding and should allow us find quality steemains easier.
Price and the general state of the crypto market has an impact on the number of new users.
All of this combined gives us an opportunity. With a reduction in churn, and a more manageable number of accounts to filter and with Dapps curating. Could we be in a position to see a growth in the number of dolphins on Steemit? I believe we could be. Steemit is lacking a pod of dolphins swimming around spreading upvotes and value. I don't feel positive about the crypto market in general for the next 12 months and if in that time, we can grow a massive pod of awesome dolphins, Steemit will be in an awesome position when the market turns for crypto and blochchain takes off in 12 months. ( I have a crystal ball....don't worry it will happen...but don't take this as financial or trading advice...)
The Queries
As mentioned I used Steemsql and PowerBI to gather and model the data. The query used to get the unique voters was
SELECT voter, timestamp FROM Txvotes (NOLOCK) where timestamp >= CONVERT(DATE,'2018-04-01') and timestamp< CONVERT(DATE,'2018-07-01')The query used to get the unique authors was
SELECT author, timestamp FROM Txcomments (NOLOCK) where timestamp >= CONVERT(DATE,'2018-04-01') and timestamp< CONVERT(DATE,'2018-07-01')To get the total unique users, I combined both of the above queries and then ran distinct counts on the name.
The query used to get the number of new accounts was
Select name, created FROM Accounts (NOLOCK)