A few major events have affected the Steemit payouts in April and May.
- Hardfork (HF) 18 at the end of March, included an adjustment to how the payout window operates.
It's now over a 7 day period. There was a transitional period in April where the reward pool was drained, and there were reduced rewards. - The STEEM price rose significantly in May.
Post rewards are shown as STEEM Dollars so if the value of STEEM is up against the dollar then the value of the rewards that are paid in the day will be higher as each STEEM will be worth more.
I haven't looked at payout graphs in a while but a bit of time has passed since HF18, the reward pool is now full and there are many new users on Steemit.
How have payouts been affected?
Thanks to @furion and SteemData we have access to lots of data from the Steem Blockchain in a digestible format.
Post Payouts
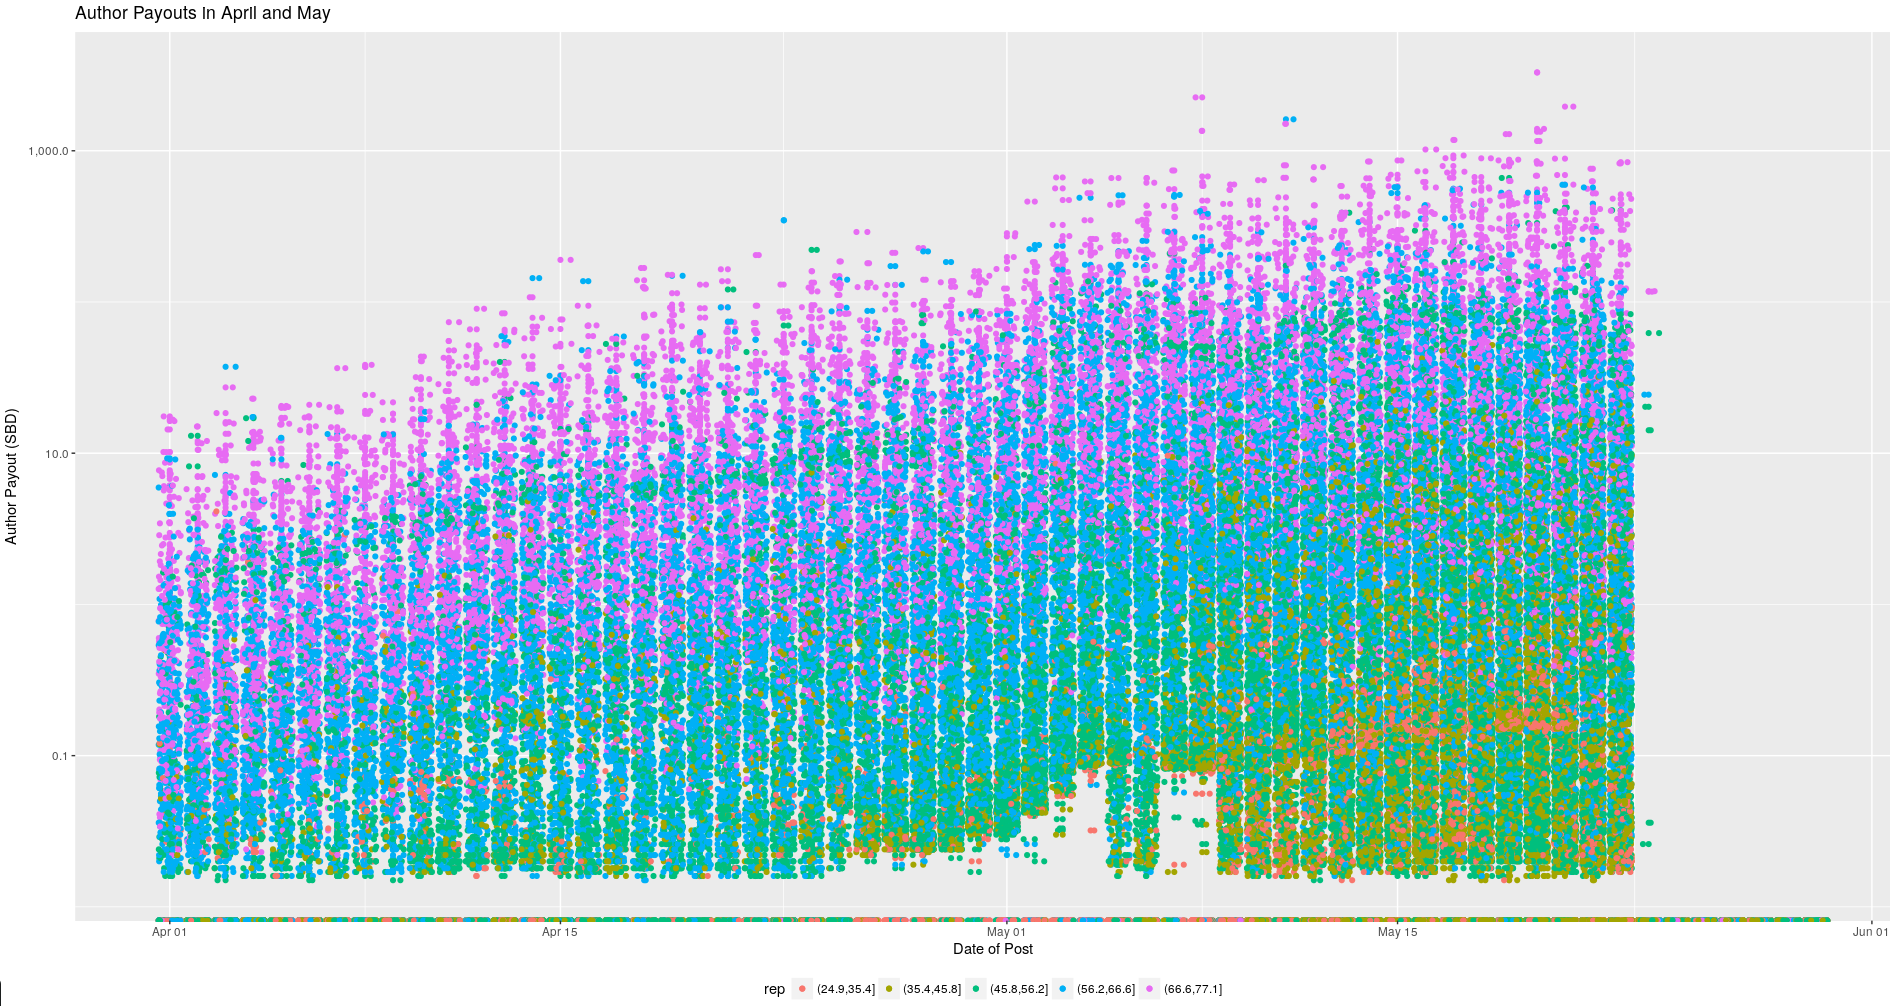
We can see a clear upward trend in post rewards, and a lot of activity in the bottom right of the graphs where people with lower reputations (likely new users) are getting significant rewards. This graph has a log scale on the Y axis, the upward trend is very significant.
Does anyone have an explanation for what has happened at the bottom of the graph at the beginning of May?
Daily Payouts
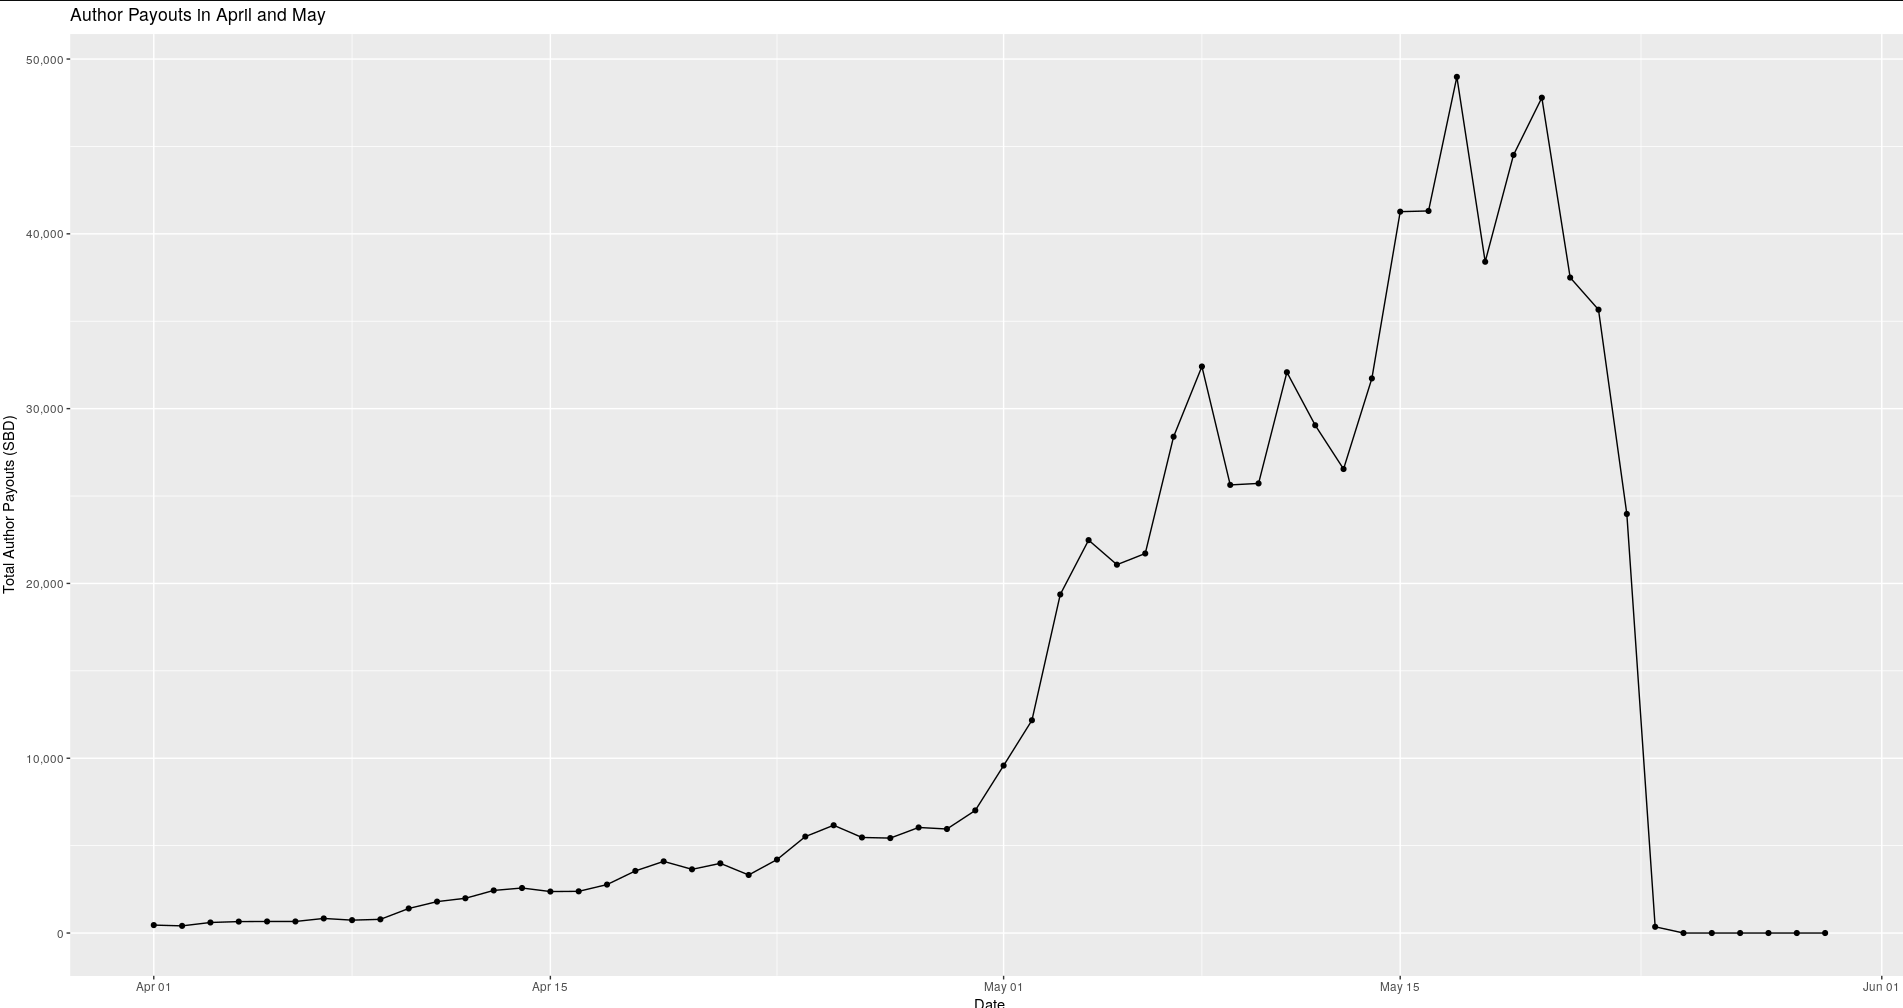
These are tracking the STEEM price, and you can clearly see the effect of the drained reward pool over the month of April, as it replenished itself. Then at the beginning of May, the reward pool was full but the price took off so the daily rewards took off too.
Just imagine what the daily rewards would be if STEEM was worth $10.
Thank you for reading this. I write on Steemit about Blockchain, Cryptocurrency, Travel and lots of random topics.