2/ 18 / 2017 STEEMIT NEWS FLASH : STEEM MARKET CAPITALIZATION.
.
STEEM MARKET CAPITALIZATION SpreadSheet Below
Some of this data is compiled from coinmarketcap.com
.
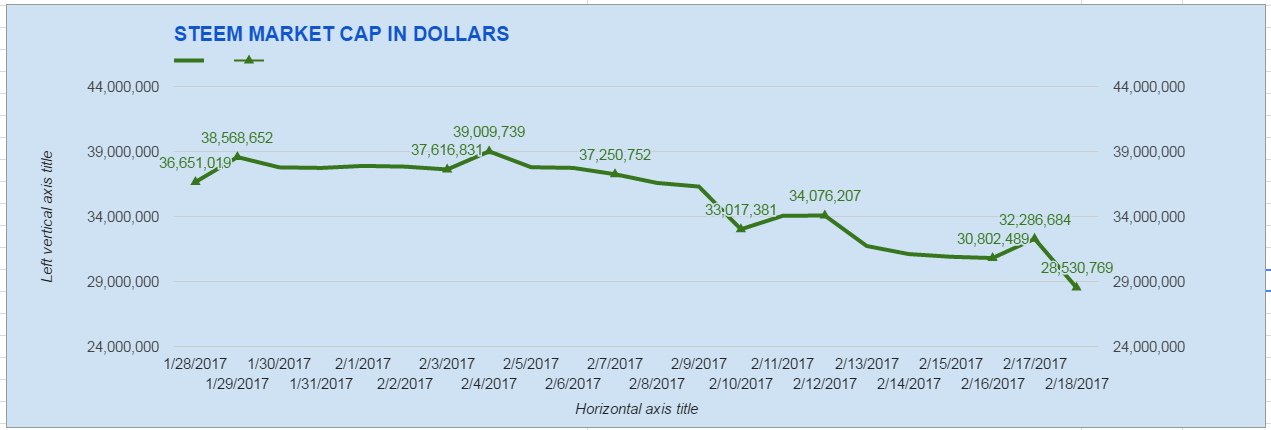
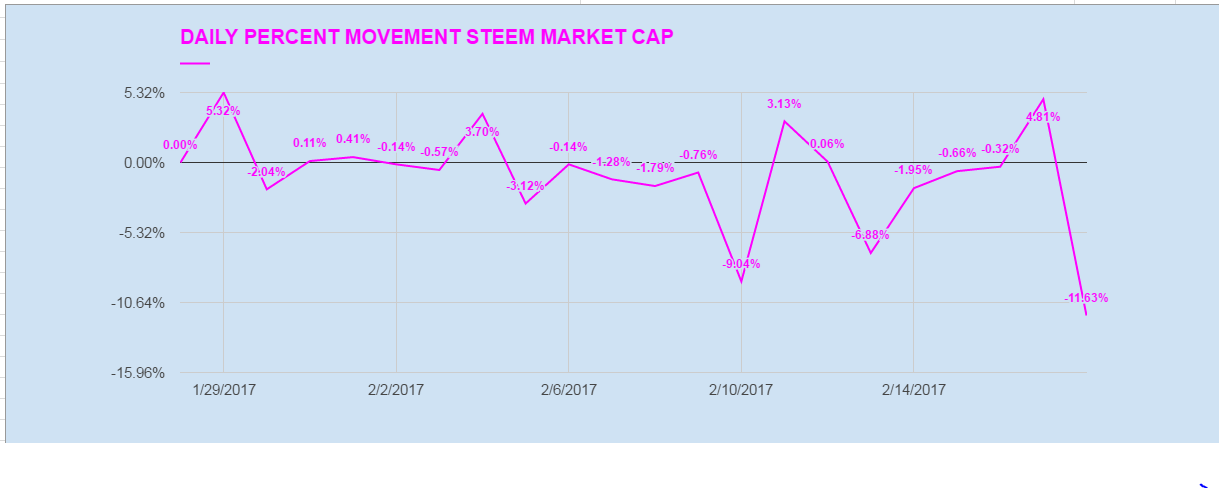
| DATE | STEEM MARKET CAP | PERCENT GAIN / LOSS |
|---|---|---|
| 1/28/2017 | 36,651,019 | NA |
| 1/29/2017 | 38,568,652 | 5.32% |
| 1/30/2017 | 37,779,621 | (-2.04%) |
| 1/31/2017 | 37,735,367 | 0.11% |
| 2/01/2017 | 37,891,658 | 0.41% |
| 2/02/2017 | 37,834,935 | (-0.14%) |
| 2/03/2017 | 37,616,831 | (-0.57%) |
| 2/04/2017 | 39,009,739 | 3.70% |
| 2/05/2017 | 37,790,439 | (-3.12%) |
| 2/06/2017 | 37,737,135 | (-0.14%) |
| 2/07/2017 | 37,250,752 | (-1.28%) |
| 2/08/2017 | 36,581,598 | (-1.79%) |
| 2/09/2017 | 36,302,477 | (-0.76%) |
| 2/10/2017 | 33,017,381 | (-9.04%) |
| 2/11/2017 | 34,053,793 | 3.13% |
| 2/12/2017 | 34,076,207 | 0.06% |
| 2/13/2017 | 31,729,404 | (-6.88%) |
| 2/14/2017 | 31,108,790 | (-1.95%) |
| 2/15/2017 | 30,901,937 | (-0.66%) |
| 2/16/2017 | 30,802,489 | (-0.32%) |
| 2/17/2016 | 32,286,684 | 4.81% |
| 2/18/2017 | 28,530,769 | (-11.63%) |
Below you will see a chart showing STEEM MARKET CAPITALIZATION since 1 / 28 / 2017 .
.

Below you will see a chart showing STEEM MARKET CAPITALIZATION PERCENT CHANGE PER DAY since 1 / 28 / 2017 .
.

.
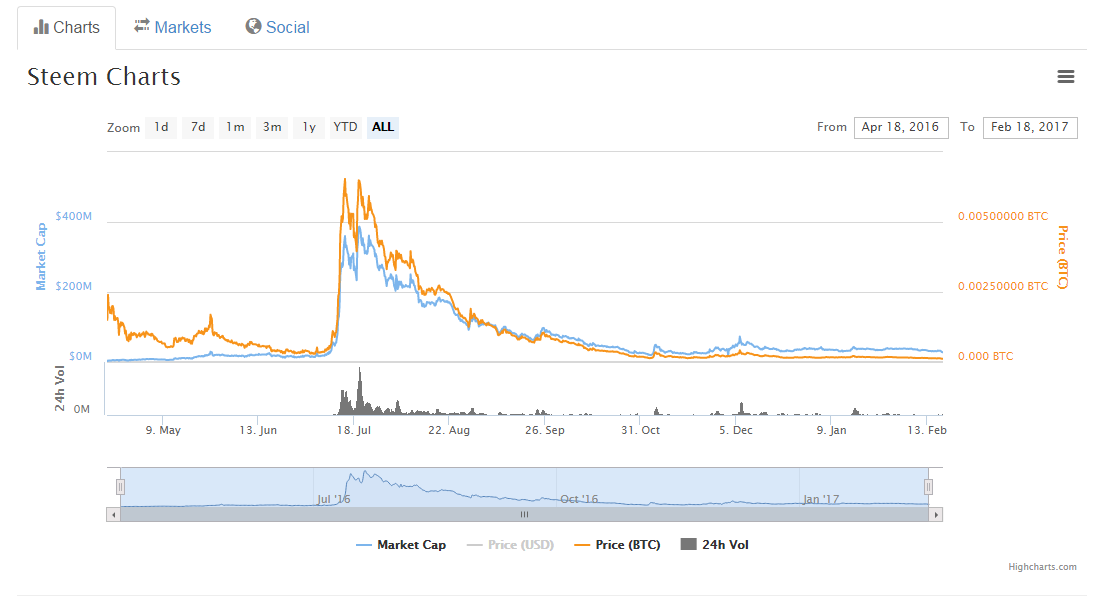
Below you will see a chart showing STEEM MARKET CAPITALIZATION from April 18, 2016 to Feb 18, 2017
.

.
SUMMARY
Steem is at it's lowest market cap $ 28,530,769 today since the Nov 3 , 2016 low of $ 19,482,568 . I fear we may soon see these Nov lows .
DISCLAIMER : This content is for informational, educational and research purposes only.
Please get the advice of a competent financial advisor before investing your money in any financial instrument.
It is strongly recommend that you consult with a licensed financial professional before using any information provided here at STEEMIT NEWS FLASH . Any market data or news commentary used here is for illustrative and informational purposes only.
Please voice your opinions in the comments below.
THANK YOU
