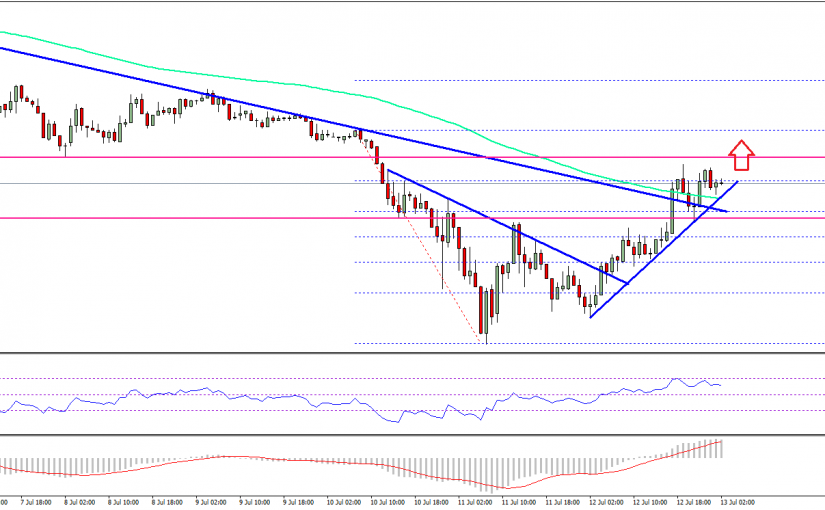
Ethereum price maintained a bit tone against the US Dollar and Bitcoin, and ETH/USD managed to settle above the $208 resistance area.
 Key Highlights
ETH price gained momentum from the $185 support against the US Dollar and moved higher.
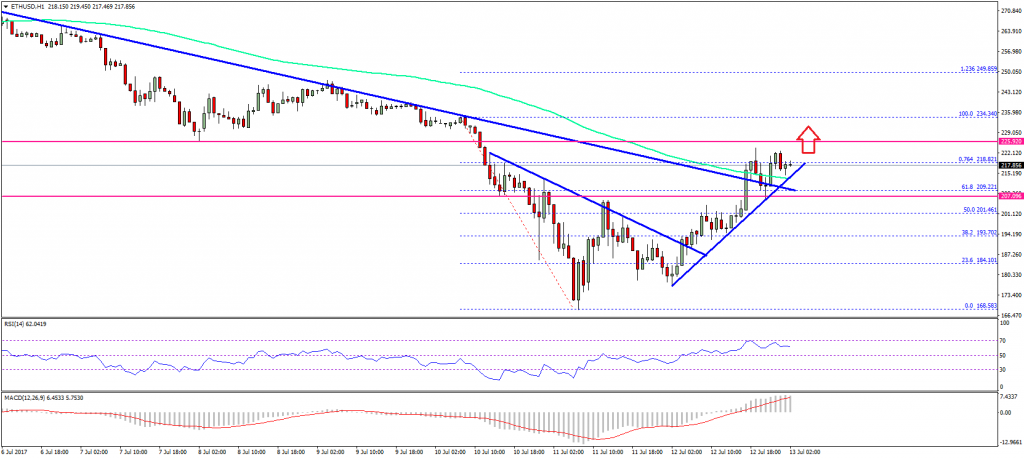
This week’s highlighted two bearish trend lines with resistances as $188 and $205 on the hourly chart of ETH/USD (data feed via SimpleFX) were cleared.
The next major hurdle for ETH buyers is around the $226 level, which is a short-term pivot.
Ethereum price maintained a bit tone against the US Dollar and Bitcoin, and ETH/USD managed to settle above the $208 resistance area.
Ethereum Price Support
There was a decent recovery started from the $168 low in ETH price against the US Dollar. Later, a support base was formed near $185 and the price started a substantial recovery. Buyers were able to take the price back above the $200 handle. Another important break was above the 50% Fib retracement level of the last decline from the $234.34 high to $168.58 low. It cleared the path for a move above the $208 resistance.
Moreover, this week’s highlighted two bearish trend lines with resistances as $188 and $205 were cleared on the hourly chart of ETH/USD. Lastly, the price is now above the $210 level and the 100 hourly simple moving average. At the moment, the price is trading near the 76.4% Fib retracement level of the last decline from the $234.34 high to $168.58 low.

A successful close above the $220 level could ignite further gains in the short term. An initial resistance is near the $226 level, which is a pivot zone. If the current momentum stays, there is a chance of a break above $226. On the downside, the $208 level and the 100 hourly simple moving average might act as a support.
Hourly MACD – The MACD is now back in the bullish zone.
Hourly RSI – The RSI is placed well above the 50 level and showing positive signs.
Major Support Level – $208
Major Resistance Level – $226
