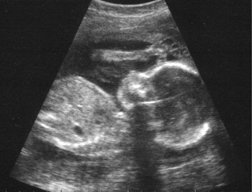
Ultrasonography

Source: I0
With this article I would like to participate in the SteemSTEM writing competition. This article is (partially) based on work from my master's thesis but the content and the formatting has been modified to fit the needs of this competition. I'm very interested in medical imaging and ultrasonography in particular and I hope to be able to spark some interest in others as well. Thank you for reading and let me know whether you would like to learn more about this topic or if you have any questions.
Ultrasonography (from Latin sonos meaning "sound") or simply medical ultrasound is a diagnostic imaging technique based on ultrasound, which has become an ubiquitous tool in many medical facilities. It was first applied to the human body for medical purposes in 1949 [0]. This paper [0] is considered to be the first exploring physical characteristics of ultrasound in various tissues in a systematic manner. Since then medical ultrasound underwent several development leaps, which led to the highly sophisticated ultrasound imaging methods we have at hand these days. Nowadays, medical ultrasound is used in cardiology, obstetrics, gynaecology, abdominal imaging and other areas. It is a mostly non-invasive technique, although invasive techniques like intra-vascular imaging are also possible [1].
Disadvantages and advantages of Ultrasonography
Ultrasonography is used to visualize internal body structures, to find potential sources of diseases or to exclude pathologies. A disadvantage of imaging methods relying on ultrasound is the inability of ultrasound waves to penetrate bone and air. A result of this is that ultrasonography has to rely on the external application of so-called ultrasound gel to ensure the coupling of ultrasound waves into the tissue. Advantages of this technique include the ability to image soft tissue, muscle tissue or organs without using potentially hazardous chemicals or ionizing radiation. Additionally, the ability to visualize internal body structures in real-time and the relative low cost and portability in comparison to other medical imaging systems pose another advantage [2].
Physics of Ultrasonography
Physically, ultrasound is defined as sound waves with frequencies higher than those audible by humans. Frequencies perceivable by humans lie between 20 Hz to 20 kHz (see figure below). Frequencies below 20 Hz are called infrasound, while frequencies above 20 kHz are called ultrasound. Frequencies of up to 1 MHz are used for sonar imaging. Sonar
(SOund Navigation And Ranging) makes use of underwater sound propagation to navigate, communicate with or detect objects on or under the surface of water. Typically, frequencies in the range of 1 MHz to 20 MHz are used for medical ultrasound while frequencies above 20 MHz can be leveraged for biomedical imaging and ultrasound microscopy technologies.

Source: Original work
Image formation
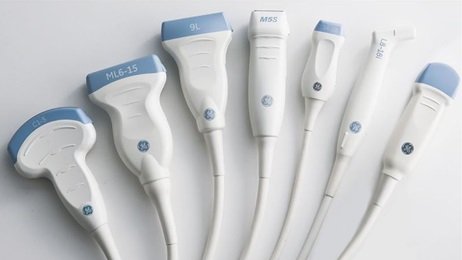
Ultrasonic images (i.e. sonograms) of internal body structures are created by sending pulses of ultrasound into body tissue and analyzing the reflected pulses using an ultrasonic transducer.

Source: I1
These devices are capable of converting ultrasound waves to electrical signals and vice versa by using piezoelectric elements. These elements are made of materials which change their physical dimensions if an electrical field is applied to them and induce an electrical field if their physical dimensions are changed. This effect is known as the piezoelectric effect and was discovered by the French physicists Pierre Curie (1859 - 1906) and Jacques Curie (1856 - 1941) in 1880 [2]. The direct and reverse piezoelectric effects are illustrated in the figure below. The shape of the piezoelectric material before any external disturbance is represented by dashed lines.

(a) Direct piezoelectric effect where a stress induces a charge separation,
(b) Reverse piezoelectric effect where a potential difference across the electrodes induces a strain
Source: [I2]
Ultrasonography modes
In ultrasound imaging several ultrasound modes can be distinguished. The most prominent modes are arguably A-mode, B-mode, M-mode and Doppler mode [3].
A-mode (or amplitude mode) refers to the simplest ultrasonography mode. It works by sending an ultrasound pulse into the body tissue using an ultrasonic transducer. The reflected echoes coming from the body tissue are then used to create a 1-D signal providing depth information for structures or organs within the body. The distance z of a structure with respect to the transducer is given as follows [4]:
z = (c * t) / 2,
where t is the time of flight (i.e. the time needed for the ultrasound pulse to travel the distance
between transducer and body structure) and c is the ultrasound propagation speed.
B-mode (also brightness mode or 2-D mode) images are created by placing A-scan images
sequentially next to one another. This method of ultrasound image acquisition is explained in more detail below.
M-mode (also time-motion mode or TM mode) enables imaging of parts of moving structures, like the heart or prenatal movements during the very early stages of pregnancy [4]. M-mode imaging, in comparison to standard B-mode imaging, achieves a higher resolution in the time domain by transmitting ultrasound pulses in quick succession along a single A-mode scan only, while loosing the ability for 2-D B-mode imaging [3].
The Doppler mode makes use of the Doppler effect in measuring and visualizing blood flow by observing the movement of red blood cells (erythrocytes) inside vessels [4]. The Doppler effect is named after the Austrian mathematician and physicist Christian Johann Doppler (1803-1853). This effect describes the frequency shift with regard to the transmit
frequency in sound waves reflected by moving senders or internal reflectors (e.g. erythrocytes in blood vessels). Measuring the frequency shift can provide information about the blood flow velocity and its direction.
Conventional B-mode imaging
The most common ultrasonography mode used today is the B-mode which enables the reception of echogenicity information about internal body structures by displaying them as a 2-D image. Echogenicity is an indicator to what extent an examined body tissue reflects an echo. It depends on the acoustic impedance Z, which is defined as follows:
z = p / U,
where p is the acoustic pressure and U is the acoustic volume flow. Each medium has its own characteristic impedance, which can vary depending on the current temperature and applied pressure [5]. Impedance differences of adjacent mediums are responsible for differing gray tones in the resulting sonographic image.
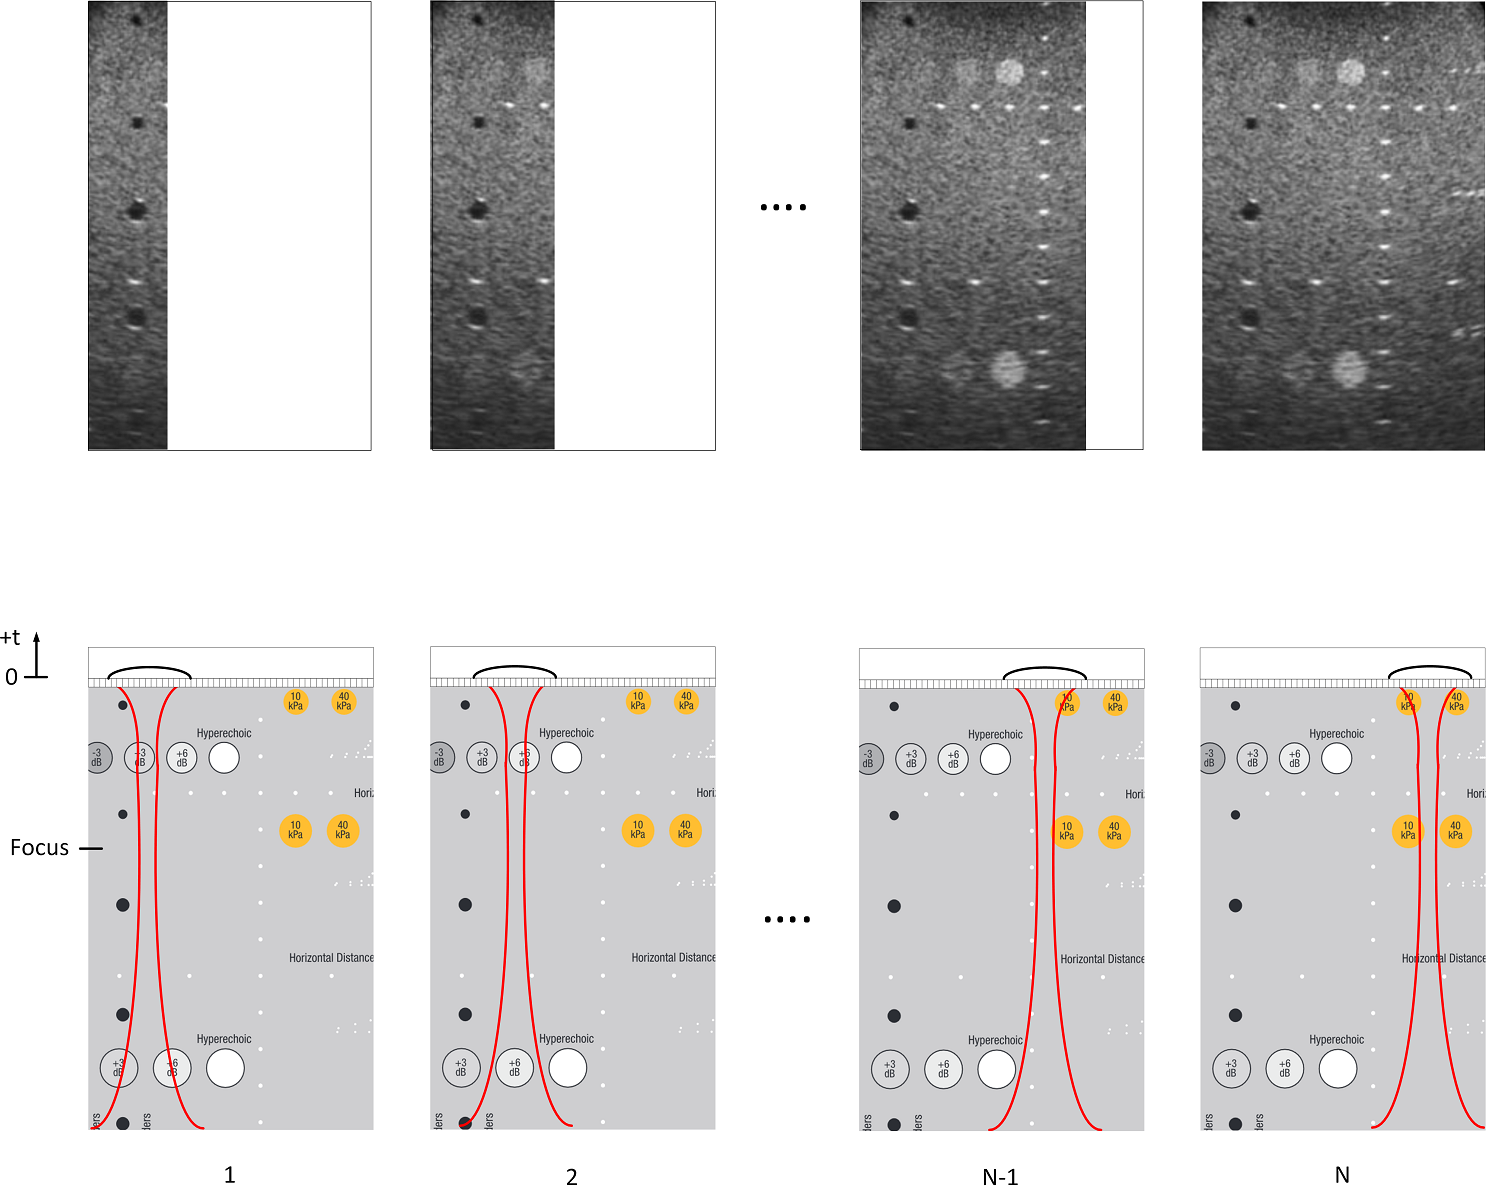
In order to create an ultrasound B-mode image, a transducer is put onto the patient’s body, which has been prepared with ultrasound gel. Ultrasound waves are emitted from the transducer in such a way that they add up constructively at one focal point. While propagating towards the focal point, the ultrasound waves reflect off on any boundaries with impedance differences along their respective propagation path. The wave reflections traveling back to the transducer can be used for creating an ultrasound image. The aperture (i.e. all active elements of a linear array transducer) is then moved in lateral direction and the transducer focuses on different focal points along a new scan line until all scan lines within the desired region of interest (ROI) have been measured [1]. This process is illustrated in the figure below. In the lower part of the figure, the line-by-line scan of a sample phantom is depicted, while the upper part shows the resulting image. Even though this process is sequential, it is still performed fast enough to produce a frame rate high enough to be seen as a single image by the human eye.

Source: Original work
The time needed to build a complete image of the ROI is given as follows:
T = (N * D * 2) / c,
with N being the number of image lines, D being the image depth and c depicting the ultrasound propagation speed. The factor 2 in the nominator results from the fact that each ultrasound pulse needs to travel the same distance twice (from and to the transducer).
As an example, one might consider a scenario in which the liver is examined by using 100 scan lines with 4 focal points each. The standard imaging depth for liver imaging is 15 cm [6]. As the ultrasound propagation speed c for liver tissue is given as 1540 m/s , the resulting equation is:
T = ( (100 * 4) * 0.15 m * 2 ) / 1540 (m/s) = 120 m / 1540 (m/s) = 0.078 s
Note that the propagation speed c of the ultrasound waves depends on the material. The table below illustrates the effect different materials have on the ultrasound propagation speed. Usually, a constant speed of 1540 m/s is assumed in most diagnostic ultrasound imaging methods because this is a good approximation of the ultrasound propagation speed in human tissue [7].
| Material | Speed (in m/s) |
|---|---|
| Fat | 1470 |
| Bone marrow | 1700 |
| Muscle | 1568 |
| Liver | 1540 |
| Brain tissue | 1530 |
| Bone (compact) | 3600 |
| Water (20 °C) | 1492 |
| Air (NN) | 331 |
Ultrasound propagation speeds for different materials [4]
References
[0]: George D Ludwig and Francis W Struthers. Considerations underlying the use of ultrasound to detect gallstones and foreign bodies in tissue. Tech. rep. DTIC Document, 1949.
[1]: Murtaza Ali, Dave Magee, and Udayan Dasgupta. “Signal Processing Overview of Ultrasound Systems for Medical Imaging”. In: (Nov. 2008).
[2]: Aaron Fenster and James C Lacefield. Ultrasound Imaging and Therapy. Taylor & Francis, 2015.
[3]: Richard S. C. Cobbold Professor of Biomedical Engineering University of Toronto
(Emeritus). Foundations of Biomedical Ultrasound. New York: Oxford University Press,
USA, 2006. ISBN : 978-0-199-77512-5.
[4]: Arnulf Oppelt. Imaging Systems for Medical Diagnostics - Fundamentals, Technical Solutions and Applications for Systems Applying Ionizing Radiation, Nuclear Magnetic Resonance and Ultrasound. New York: John Wiley & Sons, 2011. ISBN : 978-3-895-78669-3.
[5]: Finn Jacobsen et al. “Fundamentals of acoustics and noise control”. In: Department of Electrical Engineering, Technical University of Denmark (2011).
[6]: Hamid Neshat et al. “A 3D ultrasound scanning system for image guided liver interventions”. In: Medical physics 40.11 (2013), p. 112903.
[7]: Ho-Chul Shin et al. “Estimation of Average Speed of Sound Using Deconvolution of Medical Ultrasound Data”. In: Ultrasound in Medicine & Biology 36.4 (2010), pp. 623 –636. ISSN : 0301-5629. DOI : http://dx.doi.org/10.1016/j.ultrasmedbio.2010. 01 . 011.
Image references
[I2]: Aaron Fenster and James C Lacefield. Ultrasound Imaging and Therapy. Taylor & Francis, 2015.
